
Compare Reliance Power with Similar Stocks
Dashboard
Weak Long Term Fundamental Strength with a -9.71% CAGR growth in Operating Profits over the last 5 years
- Low ability to service debt as the company has a high Debt to EBITDA ratio of 6.27 times
- The company has been able to generate a Return on Equity (avg) of 0.06% signifying low profitability per unit of shareholders funds
- PAT(Q) At Rs -112.26 cr has Fallen at -258.9% (vs previous 4Q average)
- OPERATING PROFIT TO INTEREST (Q) Lowest at 1.22 times
- INTEREST(Q) Highest at Rs 474.06 cr
Underperformed the market in the last 1 year
Total Returns (Price + Dividend) 
Latest dividend: 1 per share ex-dividend date: Nov-19-2015
Risk Adjusted Returns v/s
Returns Beta

News

Reliance Power Ltd Sees Exceptional Volume Surge Amid Mixed Technical Signals
Reliance Power Ltd (RPOWER) emerged as one of the most actively traded stocks on 22 June 2026, registering a remarkable surge in volume and outperforming its sector peers. Despite a recent downgrade to a Strong Sell rating, the stock demonstrated a notable price recovery and increased investor participation, signalling a complex interplay of accumulation and distribution dynamics in the power sector’s small-cap segment.
Read full news article
Reliance Power Ltd is Rated Strong Sell
Reliance Power Ltd is rated Strong Sell by MarketsMOJO, with this rating last updated on 22 May 2026. However, the analysis and financial metrics discussed here reflect the stock's current position as of 19 June 2026, providing investors with the latest insights into the company’s performance and outlook.
Read full news article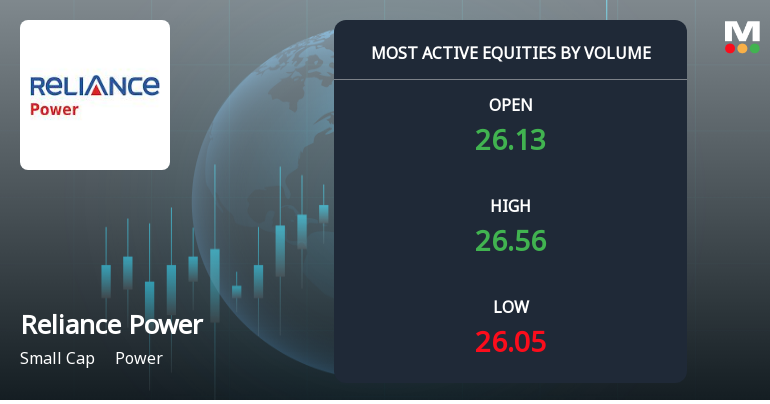
Reliance Power Ltd Sees Exceptional Volume Surge Amid Mixed Technical Signals
Reliance Power Ltd (RPOWER) emerged as one of the most actively traded stocks on 12 June 2026, registering a remarkable volume surge that outpaced sector and benchmark indices. Despite a modest price gain of 1.83%, the stock’s trading activity and technical indicators reveal a complex picture of investor sentiment and market positioning.
Read full news article Announcements
Compliances-Reg.24(A)-Annual Secretarial Compliance
29-May-2026 | Source : BSEAnnual Secretarial Compliance Report for the financial year ended March 31 2026
Announcement under Regulation 30 (LODR)-Change in Management
21-May-2026 | Source : BSEAnnouncement under Regulation 30 (LODR) - Change in Management
Board Meeting Outcome for Outcome Of The Board Meeting
21-May-2026 | Source : BSEOutcome Of The Board Meeting
Corporate Actions

No Upcoming Board Meetings

Reliance Power Ltd has declared 10% dividend, ex-date: 19 Nov 15

No Splits history available

Reliance Power Ltd has announced 3:5 bonus issue, ex-date: 30 May 08

No Rights history available
Quality key factors
Valuation key factors
Technicals key factors
 Technical Indicator Scale: Bearish, Mildly Bearish, Sideways, Mildly Bullish, Bullish Turned
 Shareholding Snapshot : Mar 2026
Shareholding Compare (%holding)
Non Institution
None
Held by 54 Schemes (0.56%)
Held by 225 FIIs (14.13%)
Reliance Infrastructure Limited (24.9%)
Vfsi Holdings Pte. Ltd. (4.61%)
48.62%
Quarterly Results Snapshot (Consolidated) - Mar'26 - QoQ

QoQ Growth in quarter ended Mar 2026 is 0.77% vs -5.13% in Dec 2025

QoQ Growth in quarter ended Mar 2026 is -2,067.34% vs -71.24% in Dec 2025
Half Yearly Results Snapshot (Consolidated) - Sep'25
Growth in half year ended Sep 2025 is 2.87% vs -5.59% in Sep 2024
Growth in half year ended Sep 2025 is -95.25% vs 620.58% in Sep 2024
Nine Monthly Results Snapshot (Consolidated) - Dec'25
YoY Growth in nine months ended Dec 2025 is 2.28% vs -5.29% in Dec 2024
YoY Growth in nine months ended Dec 2025 is -94.43% vs 268.91% in Dec 2024
Annual Results Snapshot (Consolidated) - Mar'26
YoY Growth in year ended Mar 2026 is 0.49% vs -3.92% in Mar 2025
YoY Growth in year ended Mar 2026 is -111.43% vs 242.52% in Mar 2025
About Reliance Power Ltd

Company Coordinates


