
Compare Remi Edelstahl with Similar Stocks
Dashboard
Weak Long Term Fundamental Strength with an average Return on Capital Employed (ROCE) of 3.97%
- Poor long term growth as Net Sales has grown by an annual rate of 11.52% over the last 5 years
- Low ability to service debt as the company has a high Debt to EBITDA ratio of 6.72 times
Flat results in Mar 26
With ROCE of 3.7, it has a Very Expensive valuation with a 2.5 Enterprise value to Capital Employed
Stock DNA
Iron & Steel Products
INR 252 Cr (Micro Cap)
91.00
26
0.00%
0.74
3.94%
3.49
Total Returns (Price + Dividend) 
Latest dividend: 0.6500 per share ex-dividend date: Sep-24-2008
Risk Adjusted Returns v/s
Returns Beta

News
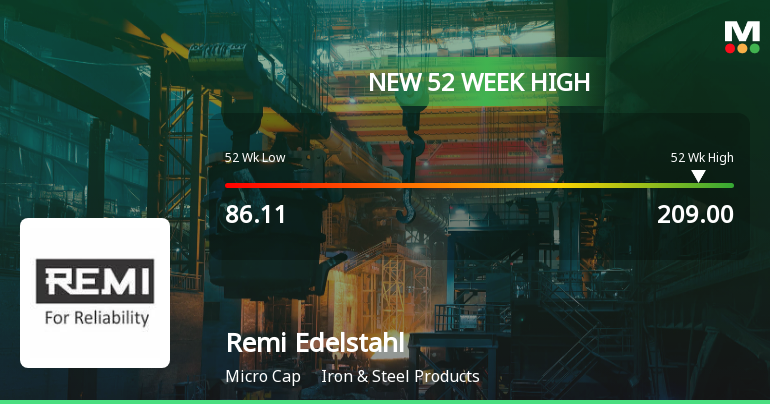
Broad-Based Technical Strength Lifts Remi Edelstahl Tubulars Ltd to 52-Week High of Rs 209
Surging past its previous peaks, Remi Edelstahl Tubulars Ltd touched a fresh 52-week high of Rs 209 on 11 Jun 2026, marking a remarkable 118.52% gain over the past year. This rally stands in stark contrast to the broader market’s subdued performance, with the Sensex down 10.70% over the same period.
Read full news article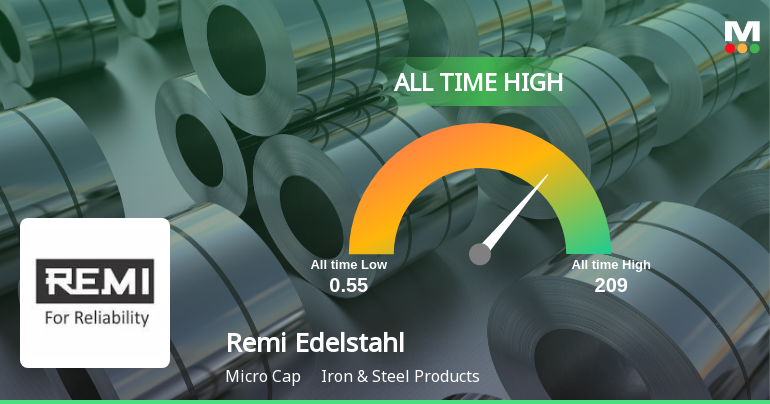

Broad-Based Technical Strength Lifts Remi Edelstahl Tubulars Ltd to 52-Week High of Rs 207
Surging to an intraday peak of Rs 207 on 09 Jun 2026, Remi Edelstahl Tubulars Ltd has marked a significant milestone by hitting a fresh 52-week and all-time high. This rally is underscored by a powerful alignment of technical indicators and sustained price momentum, setting the stock apart in a market environment where the broader Sensex remains subdued.
Read full news article Announcements
Announcement under Regulation 30 (LODR)-Analyst / Investor Meet - Outcome
10-Jun-2026 | Source : BSEOut come as per letter attached
Announcement under Regulation 30 (LODR)-Analyst / Investor Meet - Intimation
05-Jun-2026 | Source : BSEAs per attached Letter
Announcement under Regulation 30 (LODR)-Newspaper Publication
31-May-2026 | Source : BSENewspaper Advertisement for Audited Financial results for the quarter and year ended 31.03.2026
Corporate Actions

No Upcoming Board Meetings

Remi Edelstahl Tubulars Ltd has declared 15% dividend, ex-date: 24 Sep 08

No Splits history available

Remi Edelstahl Tubulars Ltd has announced 1:1 bonus issue, ex-date: 03 Nov 08

No Rights history available
Quality key factors
Valuation key factors
Technicals key factors
 Technical Indicator Scale: Bearish, Mildly Bearish, Sideways, Mildly Bullish, Bullish Turned
 Shareholding Snapshot : Mar 2026
Shareholding Compare (%holding)
Promoters
None
Held by 2 Schemes (0.07%)
Held by 0 FIIs
Remi Finance And Investment Private Limited (23.66%)
Wsg Co., Ltd. (5.31%)
20.44%
Quarterly Results Snapshot (Standalone) - Mar'26 - QoQ

QoQ Growth in quarter ended Mar 2026 is 39.04% vs 2.00% in Dec 2025
QoQ Growth in quarter ended Mar 2026 is 184.62% vs -62.14% in Dec 2025
Half Yearly Results Snapshot (Standalone) - Sep'25

Growth in half year ended Sep 2025 is 9.38% vs 13.35% in Sep 2024
Growth in half year ended Sep 2025 is -14.48% vs 680.00% in Sep 2024
Nine Monthly Results Snapshot (Standalone) - Dec'25
YoY Growth in nine months ended Dec 2025 is -3.72% vs 27.38% in Dec 2024
YoY Growth in nine months ended Dec 2025 is -28.51% vs 1,300.00% in Dec 2024
Annual Results Snapshot (Standalone) - Mar'26
YoY Growth in year ended Mar 2026 is 2.21% vs 18.30% in Mar 2025
YoY Growth in year ended Mar 2026 is 2.62% vs 92.09% in Mar 2025
About Remi Edelstahl Tubulars Ltd

Company Coordinates


