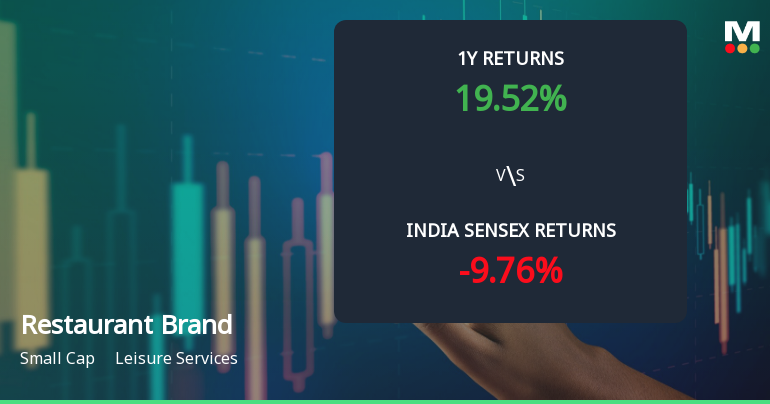
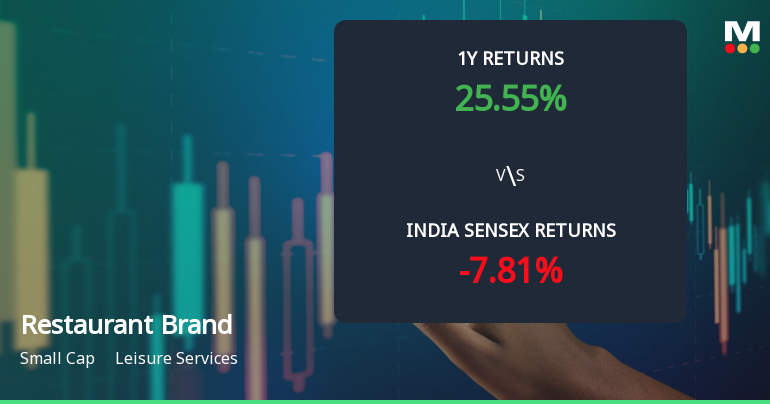
Restaurant Brand

  • Market Cap: Small Cap
  • Industry: Leisure Services
  • ISIN: INE07T201019
  • NSEID: RBA
  • BSEID: 543248
INR
95.16
0.15 (0.16%)
BSENSE

Sep 21, 03:30 PM

BSE+NSE Vol: 24.66 lacs

  • Price Points
  • Score
  • Mojo Parameters
  • Total Return
  • News and Corporate Actions
  • Key factors
  • Shareholding
  • Financials
  • CompanyCV
stock-summaryPrice Point
High/Low

1Day

52 Week

Valuation
Technical
Day's Volume

CASH

24.66 lacs (-39.63%) Volume

Shareholding (Jun 2026)

FII

9.25%

Held by 49 FIIs

DII

39.62%

Held by 59 DIIs

Promoter

9.22%

Why is Restaurant Brands Asia Ltd falling/rising?

06-Sep-2026

As of 05-Sep, Restaurant Brands Asia Ltd's stock price is at 97.04, down 0.87%, underperforming its sector. The stock has faced a 3.79% decline over the past week, with reduced investor interest and concerns about long-term fundamentals, including negative operating profits and weak debt servicing ability.

As of 05-Sep, Restaurant Brands Asia Ltd's stock price is currently at 97.04, reflecting a decrease of 0.85 or 0.87%. The stock has underperformed its sector today by 1.44%, indicating a weaker performance compared to its peers. Despite touching an intraday high of Rs 101.12 earlier in the day, the overall trend shows a decline.<BR><BR>In the short term, the stock has experienced a negative return of 3.79% over the past week, while the broader market, represented by the Sensex, has only declined by 0.97%. This suggests that the stock is facing specific challenges that are not affecting the market as a whole. Additionally, there has been a significant drop in investor participation, with delivery volume falling by 57.76% compared to the 5-day average, indicating reduced interest from investors.<BR><BR>While the stock has shown strong performance over the longer term, with a 53.81% increase year-to-date and a 20.64% rise over the past year, these gains are overshadowed by concerns regarding the company's long-term fundamentals. The average Return on Capital Employed (ROCE) is at 0%, and the company has recorded negative operating profits, which raises red flags about its financial health. Furthermore, the company's ability to service its debt is weak, as evidenced by a poor EBIT to Interest ratio of -0.87.<BR><BR>Overall, the combination of short-term underperformance, declining investor interest, and long-term fundamental weaknesses contributes to the current decline in the stock price of Restaurant Brands Asia Ltd.

View full answer

Who are in the management team of Restaurant Brand?

01-Sep-2026

The management team of Restaurant Brand includes Chairman Shivakumar Pullaya Dega, CEO Rajeev Varman, and Directors Ajay Kaul, Amit Manocha, Jaspal Singh Sabharwal, Sandeep Chaudhary, Tara Subramaniam, Rafael Odorizzi De Oliveira, along with Company Secretary Madhulika Rawat. They are responsible for guiding the company's strategic direction and operations.

The management team of Restaurant Brand includes the following key individuals:<BR><BR>1. **Shivakumar Pullaya Dega** - Chairman & Independent Director<BR>2. **Rajeev Varman** - Whole Time Director & CEO<BR>3. **Ajay Kaul** - Director<BR>4. **Amit Manocha** - Director<BR>5. **Jaspal Singh Sabharwal** - Director<BR>6. **Sandeep Chaudhary** - Independent Director<BR>7. **Tara Subramaniam** - Independent Director<BR>8. **Madhulika Rawat** - Company Secretary & Compliance Officer<BR>9. **Rafael Odorizzi De Oliveira** - Director<BR><BR>This team plays a crucial role in guiding the company's strategic direction and operations.

View full answer

What does Restaurant Brand do?

01-Sep-2026

Restaurant Brands Asia Ltd operates in the restaurant sector, originally founded as Burger King India in 2013 and rebranded in 2022. As of June 2026, it reported net sales of 823 Cr and a net loss of 28 Cr, with a market cap of INR 6,978 Cr.

Overview:<BR>Restaurant Brands Asia Ltd operates in the leisure services industry, focusing on the restaurant sector and is categorized as a small-cap company.<BR><BR>History:<BR>The company was originally incorporated as Burger King India Private Limited in 2013. It transitioned to a public limited company and changed its name to Burger King India Limited in 2019. The name was further changed to Restaurant Brands Asia Limited on February 2, 2022. The most recent quarterly results reported net sales and profit for June 2026.<BR><BR>Financial Snapshot:<BR>Net Sales: 823 Cr (Quarterly Results - Jun 2026) <BR>Net Profit: -28 Cr (Quarterly Results - Jun 2026) <BR>Market Cap: INR 6,978 Cr (Small Cap)<BR><BR>Key Metrics:<BR>P/E: N/A <BR>Industry P/E: 45 <BR>Dividend Yield: 0.00% <BR>Debt-Equity: 0.10 <BR>Return on Equity: -25.63% <BR>Price to Book: 9.97 <BR><BR>Contact Details:<BR>No Company Details Available <BR>Registrar Address: Not available.

View full answer

Who are the peers of the Restaurant Brand?

01-Sep-2026

Peers of Restaurant Brand include Devyani Intl., Travel Food, Westlife Food, Sapphire Foods, Wonderla Holiday, Imagica. Enter., United Foodbrand, Delta Corp, and Speciality Rest. Restaurant Brand has below average management and growth, with a 1-year return of 22.63%, higher than Devyani Intl. but lower than United Foodbrand's 171.12%.

Peers: The peers of Restaurant Brand are Devyani Intl., Travel Food, Westlife Food, Sapphire Foods, Wonderla Holiday, Imagica. Enter., United Foodbrand, Delta Corp, and Speciality Rest.<BR><BR>Quality Snapshot: Excellent management risk is observed at Travel Food, while Average management risk is found at Devyani Intl., Westlife Food, Sapphire Foods, Wonderla Holiday, and Delta Corp, and the rest. Below Average management risk is present at Restaurant Brand, Imagica. Enter., and United Foodbrand. Growth is Excellent at Devyani Intl., Good at Westlife Food, Sapphire Foods, and Wonderla Holiday, while Average growth is seen at Imagica. Enter. and the rest. Below Average growth is noted at Restaurant Brand and United Foodbrand. Capital Structure is Excellent at Travel Food and Wonderla Holiday, Good at Restaurant Brand and Speciality Rest., while Below Average is found at Devyani Intl., Westlife Food, Sapphire Foods, Imagica. Enter., and United Foodbrand.<BR><BR>Return Snapshot: The peer with the highest 1-year return is United Foodbrand at 171.12%, while the lowest is Devyani Intl. at -20.42%. Restaurant Brand's 1-year return is 22.63%, which is higher than Devyani Intl. but lower than United Foodbrand. Additionally, peers with negative six-month returns include Delta Corp.

View full answer

How big is Restaurant Brand?

01-Sep-2026

As of 31st August, Restaurant Brands Asia Ltd has a market capitalization of 6,978.00 Cr and reported net sales of 2,947.53 Cr with a net loss of 173.50 Cr over the last four quarters.

As of 31st August, <BR><BR>Market Cap: Restaurant Brands Asia Ltd has a market capitalization of 6,978.00 Cr, categorizing it as a Small Cap company.<BR><BR>Recent Quarterly Performance: The sum of Net Sales for the latest 4 quarters is 2,947.53 Cr, while the sum of Net Profit for the same period shows a loss of 173.50 Cr.<BR><BR>Balance Sheet Snapshot: The reporting period for the balance sheet is March 2026. Shareholder's Funds are valued at 721.11 Cr, and Total Assets amount to 3,382.31 Cr.

View full answer

Are Restaurant Brands Asia Ltd latest results good or bad?

04-Aug-2026

Restaurant Brands Asia Ltd's latest results show strong revenue growth of 17.90% year-on-year, reaching ₹822.61 crores, but the company reported a net loss of ₹28.35 crores, indicating ongoing profitability challenges. Overall, while revenue growth is positive, the persistent losses and high debt levels suggest a concerning financial outlook.

Restaurant Brands Asia Ltd's latest results present a mixed picture. On one hand, the company achieved a significant revenue growth of 17.90% year-on-year, reaching ₹822.61 crores, which is the highest quarterly revenue in its history. This growth reflects successful store expansions and improving consumer demand.<BR><BR>However, the company continues to face challenges with profitability, reporting a net loss of ₹28.35 crores for Q1 FY27, which is a 32.40% increase in losses compared to the same quarter last year. This indicates that despite strong revenue growth, the company struggles to convert that into sustainable profits. The operating margin improved to 12.18%, showing better cost management, but the overall financial picture remains concerning due to high interest and depreciation costs that overshadow operating profits.<BR><BR>Additionally, the company's return on equity is negative at -25.63%, and it has a high debt-to-equity ratio of 1.82 times, which raises financial risk. The ongoing losses and deteriorating quarterly performance, despite revenue growth, suggest that the company is at a critical juncture where it needs to focus on achieving profitability.<BR><BR>In summary, while the revenue growth is a positive sign, the persistent losses and financial challenges indicate that the company's latest results are more concerning than favorable.

View full answer

Should I buy, sell or hold Restaurant Brands Asia Ltd?

04-Aug-2026

When is the next results date for Restaurant Brands Asia Ltd?

28-Jul-2026

The next results date for Restaurant Brands Asia Ltd is 03 August 2026.

The next results date for Restaurant Brands Asia Ltd is on 03 August 2026.

View full answer

Is Restaurant Brand technically bullish or bearish?

07-Nov-2025

As of November 6, 2025, the technical analysis for Restaurant Brand indicates a strong bearish trend, supported by bearish MACD, Bollinger Bands, and moving averages across weekly and monthly time frames.

As of 6 November 2025, the technical trend has changed from mildly bearish to bearish. The current technical stance is bearish with a strong indication of weakness. The MACD is bearish on both weekly and monthly time frames, and Bollinger Bands also reflect a bearish sentiment in both time frames. Daily moving averages confirm the bearish trend. The KST is bearish on both weekly and monthly levels, while Dow Theory indicates a mildly bearish stance on the weekly and monthly charts. Overall, the indicators collectively suggest a significant bearish outlook for Restaurant Brand.

View full answer

How has been the historical performance of Restaurant Brand?

30-Oct-2025

Restaurant Brand has experienced rising net sales and operating income from 1,003.96 Cr in Mar'21 to 2,550.72 Cr in Mar'25, but continues to face losses in profit before and after tax, with total liabilities and assets both increasing significantly during the same period. Despite these challenges, cash flow from operating activities improved to 350.00 Cr in Mar'25.

Answer:<BR>The historical performance of Restaurant Brand shows a trend of increasing net sales and operating income, alongside persistent losses in profit before tax and profit after tax.<BR><BR>Breakdown:<BR>Restaurant Brand's net sales have shown a consistent upward trajectory, rising from 1,003.96 Cr in Mar'21 to 2,550.72 Cr in Mar'25. Total operating income followed a similar pattern, reaching 2,550.72 Cr in Mar'25, up from 1,003.96 Cr in Mar'21. However, the company has faced challenges with raw material costs and other expenses, leading to total expenditure increasing from 979.02 Cr in Mar'21 to 2,282.31 Cr in Mar'25. Despite the growth in sales, the operating profit (PBDIT) has remained negative, with a profit before tax of -232.79 Cr in Mar'25, only slightly improved from -282.06 Cr in Mar'21. Profit after tax also remained negative, at -216.20 Cr in Mar'25. The company's total liabilities increased significantly from 1,963.39 Cr in Mar'21 to 3,462.67 Cr in Mar'25, while total assets rose from 1,963.39 Cr to 3,462.67 Cr during the same period. Cash flow from operating activities improved to 350.00 Cr in Mar'25, contributing to a net cash inflow of 502.00 Cr, a notable recovery from previous years.

View full answer

Who are the top shareholders of the Restaurant Brand?

17-Jul-2025

The top shareholders of Restaurant Brand include mutual funds (29.62%), foreign institutional investors (20.36%), and individual investors (16.99%). The largest promoter is Qsr Asia Pte Ltd with an 11.27% stake, while HDFC Trustee Company Limited holds the highest public share at 8.92%.

The top shareholders of Restaurant Brand include a mix of mutual funds, foreign institutional investors (FIIs), and individual investors. The majority of the shares are held by mutual funds, accounting for 29.62% through 13 different schemes. FIIs hold 20.36% of the shares, represented by 83 different investors. <BR><BR>The largest promoter is Qsr Asia Pte Ltd, which has a holding of 11.27%. Among public shareholders, HDFC Trustee Company Limited, specifically through the HDFC Flexi Cap Fund, is the highest with an 8.92% stake. Additionally, individual investors collectively hold 16.99% of the company's shares.

View full answer

Is Restaurant Brand overvalued or undervalued?

09-Jun-2025

As of February 10, 2021, Restaurant Brand is considered risky and overvalued, with a negative PE ratio of -21.62, a high EV to EBITDA ratio of 22.09, a low ROE of -23.80%, and a 1-year stock return of -27.78%, significantly underperforming compared to its peers and the Sensex.

As of 10 February 2021, the valuation grade for Restaurant Brand has moved from does not qualify to risky. The company is currently considered overvalued based on its financial ratios. Notably, the PE Ratio stands at -21.62, indicating negative earnings, while the EV to EBITDA ratio is 22.09, suggesting a high valuation relative to earnings before interest, taxes, depreciation, and amortization. Additionally, the ROE is concerningly low at -23.80%, reflecting poor profitability.<BR><BR>In comparison to its peers, Restaurant Brand's valuation metrics are significantly less favorable. For instance, Page Industries Ltd. has a PE ratio of 70.7, while Jubilant FoodWorks Ltd. shows a PE of 203.42, both indicating a premium valuation compared to Restaurant Brand. The company's recent stock performance has also lagged behind the Sensex, with a 1-year return of -27.78% compared to the Sensex's 7.55%, reinforcing the view that Restaurant Brand is currently overvalued.

View full answer

Has Restaurant Brand declared dividend?

06-Jun-2025

No Dividend History Available

iScoreScore
Click here to find our call on this stock
Strong Sell
Sell
Hold
Buy
Strong Buy

Dashboard

1

Weak Long Term Fundamental Strength with a 13.61% CAGR growth in Operating Profits over the last 5 years

  • Company's ability to service its debt is weak with a poor EBIT to Interest (avg) ratio of -0.87
2

Flat results in Jun 26

3

Risky - Negative Operating Profits

stock-summaryMojo Parameters

Mojo Parameters

Loading Valuation Snapshot...

Stock DNA

stock-summary
Industry

Leisure Services

stock-summary
Market cap

INR 6,920 Cr (Small Cap)

stock-summary
P/E

NA (Loss Making)

stock-summary
Industry P/E

45

stock-summary
Dividend Yield

0.00%

stock-summary
Debt Equity

0.10

stock-summary
Return on Equity

-25.63%

stock-summary
Price to Book

9.38

Revenue and Profits:
Net Sales:
823 Cr
(Quarterly Results - Jun 2026)
Net Profit:
-28 Cr
stock-summaryTotal Returns
Total Returns (Price + Dividend) stock-summary
Dividend Yield (0%)
TimePeriod
Price Return
Dividend Return
Total Return
3 Months
29.61%
0%
29.61%
6 Months
55.46%
0%
55.46%
1 Year
10.54%
0%
10.54%
2 Years
-11.73%
0%
-11.73%
3 Years
-23.5%
0%
-23.5%
4 Years
-23.1%
0%
-23.1%
5 Years
-40.65%
0%
-40.65%

Restaurant Brand for the last several years.

Risk Adjusted Returns v/s stock-summary
Returns Beta
Icon
Beta has not been calculated since enough price history is not available
stock-summaryNews & Corporate Actions

Announcements stock-summary

Announcement under Regulation 30 (LODR)-Acquisition

16-Sep-2026 | Source : BSE

Announcement under Regulation 30 read with Schedule III of SEBI LODR Regulations 2015

Announcement under Regulation 30 (LODR)-Updates on Acquisition

15-Sep-2026 | Source : BSE

Restaurant Brands Asia Limited has completed the subscription of redeemable cumulative non-convertible preference shares of PT Sari Burger Indonesia

Announcement under Regulation 30 (LODR)-Press Release / Media Release

10-Sep-2026 | Source : BSE

Press Release on Burger King India hits 600 Restaurants marking a milestone in its growth story

Corporate Actions stock-summary

stock-summary
BOARD MEETING

No Upcoming Board Meetings

stock-summary
DIVIDEND

No Dividend history available

stock-summary
SPLITS

No Splits history available

stock-summary
BONUS

No Bonus history available

stock-summary
RIGHTS

No Rights history available

stock-summaryKey Factors

Quality key factors stock-summary

Factor
Value
Sales Growth (5y)
15.06%
EBIT Growth (5y)
13.61%
EBIT to Interest (avg)
-0.87
Debt to EBITDA (avg)
7.43
Net Debt to Equity (avg)
0.10
Sales to Capital Employed (avg)
1.04
Tax Ratio
0
Dividend Payout Ratio
0
Pledged Shares
0
Institutional Holding
48.87%
ROCE (avg)
-7.36%
ROE (avg)
0

Valuation key factors

Factor
Value
P/E Ratio
NA (Loss Making)
Industry P/E
45
Price to Book Value
9.40
EV to EBIT
-156.27
EV to EBITDA
19.26
EV to Capital Employed
8.62
EV to Sales
2.32
PEG Ratio
NA
Dividend Yield
NA
ROCE (Latest)
-7.70%
ROE (Latest)
-25.63%

Technicals key factors

Indicator
Weekly
Monthly
MACD
Bullish
Bullish
RSI
No Signal
No Signal
Bollinger Bands
Bullish
Mildly Bullish
Moving Averages
Bullish (Daily)
KST
Bullish
Mildly Bullish
Dow Theory
No Trend
No Trend
OBV
No Trend
No Trend
stock-summary Technical Indicator Scale: Bearish, Mildly Bearish, Sideways, Mildly Bullish, Bullish  Turned 
stock-summaryShareholding
Shareholding Snapshot : Jun 2026stock-summary
Shareholding Compare (%holding) stock-summary
Majority shareholders

Non Institution

Pledged Promoter Holdings

None

Mutual Funds

Held by 14 Schemes (22.23%)

FIIs

Held by 49 FIIs (9.25%)

Promoter with highest holding

Qsr Asia Pte Ltd (9.22%)

Highest Public shareholder

Lenexis Foodworks Private Limited (18.06%)

Individual Investors Holdings

16.21%

stock-summaryFinancial
[
  {
    "link": "quarterly",
    "btn_text": "All Quarterly Results",
    "header": "Quarterly Results Snapshot (Consolidated) - Jun'26 - QoQ",
    "rhs": [
      {
        "prefix": "Net Sales ",
        "suffix": "QoQ Growth in quarter ended Jun 2026 is 16.38% vs -1.09% in Mar 2026",
        "dir": 1
      },
      {
        "prefix": "Consolidated Net Profit ",
        "suffix": "QoQ Growth in quarter ended Jun 2026 is 34.09% vs 1.22% in Mar 2026",
        "dir": 1
      }
    ],
    "table": {
      "header": [
        "Jun'26",
        "Mar'26",
        "Change(%)"
      ],
      "body": [
        {
          "field": "Net Sales",
          "val1": "822.61",
          "val2": "706.84",
          "chgp": "16.38%",
          "chgp_class": "positive"
        },
        {
          "field": "Operating Profit (PBDIT) excl Other Income",
          "val1": "100.19",
          "val2": "95.01",
          "chgp": "5.45%",
          "chgp_class": "positive"
        },
        {
          "field": "Interest",
          "val1": "49.48",
          "val2": "49.82",
          "chgp": "-0.68%",
          "chgp_class": "positive"
        },
        {
          "field": "Exceptional Items",
          "val1": "0.00",
          "val2": "0.00",
          "chgp": "",
          "chgp_class": "neutral"
        },
        {
          "field": "Consolidate Net Profit",
          "val1": "-28.35",
          "val2": "-43.01",
          "chgp": "34.09%",
          "chgp_class": "positive"
        },
        {
          "field": "Operating Profit Margin (Excl OI)",
          "val1": "12.18%",
          "val2": "13.44%",
          "chgp": "-1.26%",
          "chgp_class": "negative"
        }
      ]
    }
  },
  {
    "link": "half-yearly",
    "btn_text": "All Half Yearly Results",
    "header": "Half Yearly Results Snapshot (Consolidated) - Sep'25",
    "rhs": [
      {
        "prefix": "Net Sales ",
        "suffix": " Growth in half year ended Sep 2025 is 9.54% vs 3.51% in Sep 2024",
        "dir": 1
      },
      {
        "prefix": "Consolidated Net Profit ",
        "suffix": " Growth in half year ended Sep 2025 is 8.22% vs -13.50% in Sep 2024",
        "dir": 1
      }
    ],
    "table": {
      "header": [
        "Sep'25",
        "Sep'24",
        "Change(%)"
      ],
      "body": [
        {
          "field": "Net Sales",
          "val1": "1,401.15",
          "val2": "1,279.11",
          "chgp": "9.54%",
          "chgp_class": "positive"
        },
        {
          "field": "Operating Profit (PBDIT) excl Other Income",
          "val1": "143.74",
          "val2": "126.38",
          "chgp": "13.74%",
          "chgp_class": "positive"
        },
        {
          "field": "Interest",
          "val1": "92.41",
          "val2": "75.49",
          "chgp": "22.41%",
          "chgp_class": "negative"
        },
        {
          "field": "Exceptional Items",
          "val1": "0.00",
          "val2": "0.00",
          "chgp": "",
          "chgp_class": "neutral"
        },
        {
          "field": "Consolidate Net Profit",
          "val1": "-100.53",
          "val2": "-109.53",
          "chgp": "8.22%",
          "chgp_class": "positive"
        },
        {
          "field": "Operating Profit Margin (Excl OI)",
          "val1": "10.26%",
          "val2": "9.88%",
          "chgp": "0.38%",
          "chgp_class": "positive"
        }
      ]
    }
  },
  {
    "link": "nine-monthly",
    "btn_text": "All Nine Monthly Results",
    "header": "Nine Monthly Results Snapshot (Consolidated) - Dec'25",
    "rhs": [
      {
        "prefix": "Net Sales ",
        "suffix": "YoY Growth in nine months ended Dec 2025 is 10.30% vs 4.25% in Dec 2024",
        "dir": 1
      },
      {
        "prefix": "Consolidated Net Profit ",
        "suffix": "YoY Growth in nine months ended Dec 2025 is 9.92% vs -20.54% in Dec 2024",
        "dir": 1
      }
    ],
    "table": {
      "header": [
        "Dec'25",
        "Dec'24",
        "Change(%)"
      ],
      "body": [
        {
          "field": "Net Sales",
          "val1": "2,115.80",
          "val2": "1,918.17",
          "chgp": "10.30%",
          "chgp_class": "positive"
        },
        {
          "field": "Operating Profit (PBDIT) excl Other Income",
          "val1": "233.25",
          "val2": "195.94",
          "chgp": "19.04%",
          "chgp_class": "positive"
        },
        {
          "field": "Interest",
          "val1": "139.55",
          "val2": "115.19",
          "chgp": "21.15%",
          "chgp_class": "negative"
        },
        {
          "field": "Exceptional Items",
          "val1": "-2.25",
          "val2": "0.00",
          "chgp": "",
          "chgp_class": "neutral"
        },
        {
          "field": "Consolidate Net Profit",
          "val1": "-144.07",
          "val2": "-159.93",
          "chgp": "9.92%",
          "chgp_class": "positive"
        },
        {
          "field": "Operating Profit Margin (Excl OI)",
          "val1": "11.02%",
          "val2": "10.21%",
          "chgp": "0.81%",
          "chgp_class": "positive"
        }
      ]
    }
  },
  {
    "link": "annual",
    "btn_text": "All Annual Results",
    "header": "Annual Results Snapshot (Consolidated) - Mar'26",
    "rhs": [
      {
        "prefix": "Net Sales ",
        "suffix": "YoY Growth in year ended Mar 2026 is 10.66% vs 4.66% in Mar 2025",
        "dir": 1
      },
      {
        "prefix": "Consolidated Net Profit ",
        "suffix": "YoY Growth in year ended Mar 2026 is 13.47% vs 0.80% in Mar 2025",
        "dir": 1
      }
    ],
    "table": {
      "header": [
        "Mar'26",
        "Mar'25",
        "Change(%)"
      ],
      "body": [
        {
          "field": "Net Sales",
          "val1": "2,822.64",
          "val2": "2,550.72",
          "chgp": "10.66%",
          "chgp_class": "positive"
        },
        {
          "field": "Operating Profit (PBDIT) excl Other Income",
          "val1": "328.26",
          "val2": "268.41",
          "chgp": "22.30%",
          "chgp_class": "positive"
        },
        {
          "field": "Interest",
          "val1": "189.38",
          "val2": "160.89",
          "chgp": "17.71%",
          "chgp_class": "negative"
        },
        {
          "field": "Exceptional Items",
          "val1": "-2.25",
          "val2": "0.00",
          "chgp": "",
          "chgp_class": "neutral"
        },
        {
          "field": "Consolidate Net Profit",
          "val1": "-187.08",
          "val2": "-216.20",
          "chgp": "13.47%",
          "chgp_class": "positive"
        },
        {
          "field": "Operating Profit Margin (Excl OI)",
          "val1": "11.63%",
          "val2": "10.52%",
          "chgp": "1.11%",
          "chgp_class": "positive"
        }
      ]
    }
  }
]

Quarterly Results Snapshot (Consolidated) - Jun'26 - QoQstock-summary

Jun'26
Mar'26
Change(%)
Net Sales
822.61
706.84
16.38%
Operating Profit (PBDIT) excl Other Income
100.19
95.01
5.45%
Interest
49.48
49.82
-0.68%
Exceptional Items
0.00
0.00
Consolidate Net Profit
-28.35
-43.01
34.09%
Operating Profit Margin (Excl OI)
12.18%
13.44%
-1.26%
Values in Rs Cr.
Direction Arrows
Net Sales

QoQ Growth in quarter ended Jun 2026 is 16.38% vs -1.09% in Mar 2026

Direction Arrows
Consolidated Net Profit

QoQ Growth in quarter ended Jun 2026 is 34.09% vs 1.22% in Mar 2026

Half Yearly Results Snapshot (Consolidated) - Sep'25stock-summary

Sep'25
Sep'24
Change(%)
Net Sales
1,401.15
1,279.11
9.54%
Operating Profit (PBDIT) excl Other Income
143.74
126.38
13.74%
Interest
92.41
75.49
22.41%
Exceptional Items
0.00
0.00
Consolidate Net Profit
-100.53
-109.53
8.22%
Operating Profit Margin (Excl OI)
10.26%
9.88%
0.38%
Values in Rs Cr.
Direction Arrows
Net Sales

Growth in half year ended Sep 2025 is 9.54% vs 3.51% in Sep 2024

Direction Arrows
Consolidated Net Profit

Growth in half year ended Sep 2025 is 8.22% vs -13.50% in Sep 2024

Nine Monthly Results Snapshot (Consolidated) - Dec'25stock-summary

Dec'25
Dec'24
Change(%)
Net Sales
2,115.80
1,918.17
10.30%
Operating Profit (PBDIT) excl Other Income
233.25
195.94
19.04%
Interest
139.55
115.19
21.15%
Exceptional Items
-2.25
0.00
Consolidate Net Profit
-144.07
-159.93
9.92%
Operating Profit Margin (Excl OI)
11.02%
10.21%
0.81%
Values in Rs Cr.
Direction Arrows
Net Sales

YoY Growth in nine months ended Dec 2025 is 10.30% vs 4.25% in Dec 2024

Direction Arrows
Consolidated Net Profit

YoY Growth in nine months ended Dec 2025 is 9.92% vs -20.54% in Dec 2024

Annual Results Snapshot (Consolidated) - Mar'26stock-summary

Mar'26
Mar'25
Change(%)
Net Sales
2,822.64
2,550.72
10.66%
Operating Profit (PBDIT) excl Other Income
328.26
268.41
22.30%
Interest
189.38
160.89
17.71%
Exceptional Items
-2.25
0.00
Consolidate Net Profit
-187.08
-216.20
13.47%
Operating Profit Margin (Excl OI)
11.63%
10.52%
1.11%
Values in Rs Cr.
Direction Arrows
Net Sales

YoY Growth in year ended Mar 2026 is 10.66% vs 4.66% in Mar 2025

Direction Arrows
Consolidated Net Profit

YoY Growth in year ended Mar 2026 is 13.47% vs 0.80% in Mar 2025

stock-summaryCompany CV
About Restaurant Brands Asia Ltd stock-summary
stock-summary
Restaurant Brands Asia Ltd
Small Cap
Leisure Services
Restaurant Brands Asia Limited was originally incorporated as Burger King India Private Limited on November 11, 2013 at Mumbai. Subsequently, the Company converted into a Public Limited Company and name of the Company was changed to Burger King India Limited on September 25, 2019. Thereafter, name of the Company was changed from "Burger King India Limited" to "Restaurant Brands Asia Limited" with effect from February 2, 2022.
Company Coordinates stock-summary
Icon
No Company Details Available