
Compare Rhetan TMT Ltd with Similar Stocks
Dashboard
Poor Management Efficiency with a low ROCE of 3.49%
- The company has been able to generate a Return on Capital Employed (avg) of 3.49% signifying low profitability per unit of total capital (equity and debt)
Low ability to service debt as the company has a high Debt to EBITDA ratio of 6.29 times
Healthy long term growth as Operating profit has grown by an annual rate 40.21%
Positive results in Mar 26
With ROCE of 4, it has a Very Expensive valuation with a 16.6 Enterprise value to Capital Employed
Stock DNA
Iron & Steel Products
INR 2,374 Cr (Small Cap)
238.00
NA
0.00%
0.38
9.48%
22.58
Total Returns (Price + Dividend) 
Rhetan TMT Ltd for the last several years.
Risk Adjusted Returns v/s
Returns Beta

News
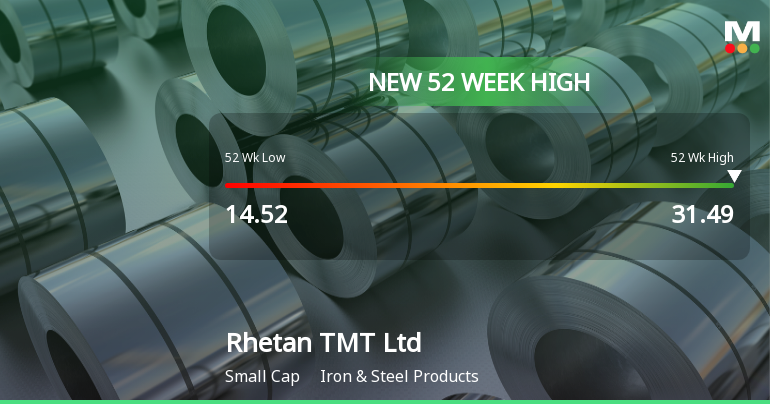
Broad-Based Technical Strength Lifts Rhetan TMT Ltd to 52-Week High of Rs 31.49
With a decisive break above Rs 31.49 on 11 Jun 2026, Rhetan TMT Ltd has reached a new 52-week high, extending its impressive 69.98% gain over the past year. This milestone comes amid a backdrop of strong technical momentum and sustained price strength across multiple timeframes.
Read full news article
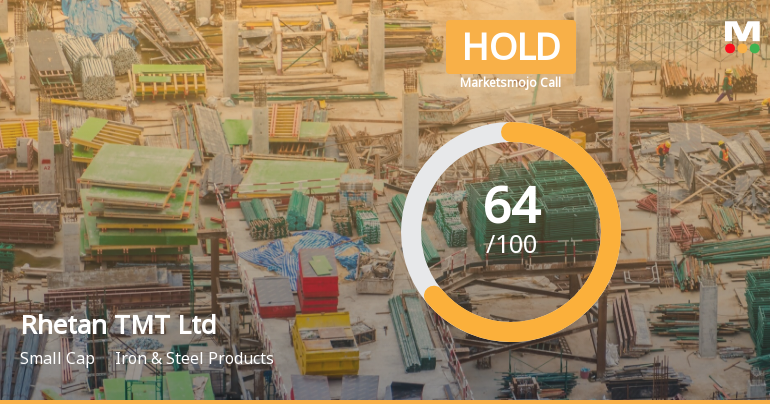
Rhetan TMT Ltd is Rated Hold by MarketsMOJO
Rhetan TMT Ltd is rated 'Hold' by MarketsMOJO, with this rating last updated on 23 April 2026. While the rating change occurred on that date, the analysis and financial metrics discussed here reflect the stock’s current position as of 08 June 2026, providing investors with an up-to-date view of the company’s performance and outlook.
Read full news article Announcements
Appointment of Company Secretary and Compliance Officer
06-Jun-2026 | Source : BSEAppointment of Mr. Tanuj Jain (A80781) as a Company Secretary and Compliance Officer of the Company w.e.f. June 06 2026
Board Meeting Outcome for Board Meeting Held On June 06 2026
06-Jun-2026 | Source : BSEOutcome of Board meeting_appointment of Mr. Tanuj Jain (A80781) as a Company Secretary and Compliance Officer.
Board Meeting Intimation for Board Meeting To Be Held On 06Th June 2026
03-Jun-2026 | Source : BSERhetan TMT Ltdhas informed BSE that the meeting of the Board of Directors of the Company is scheduled on 06/06/2026 inter alia to consider and approve 1. Appointment of Company Secretary and Compliance officer of the Company. 2. Any other business with the permission of chair.
Corporate Actions

No Upcoming Board Meetings

No Dividend history available

Rhetan TMT Ltd has announced 1:10 stock split, ex-date: 10 Mar 23

Rhetan TMT Ltd has announced 11:4 bonus issue, ex-date: 10 Mar 23

No Rights history available
Quality key factors
Valuation key factors
Technicals key factors
 Technical Indicator Scale: Bearish, Mildly Bearish, Sideways, Mildly Bullish, Bullish Turned
 Shareholding Snapshot : Mar 2026
Shareholding Compare (%holding)
Promoters
None
Held by 0 Schemes
Held by 6 FIIs (0.87%)
Ashoka Metcast Limited (55.52%)
Akhil Retail Private Limited (6.52%)
13.32%
Quarterly Results Snapshot (Standalone) - Mar'26 - QoQ

QoQ Growth in quarter ended Mar 2026 is 38.05% vs 29.20% in Dec 2025

QoQ Growth in quarter ended Mar 2026 is -50.11% vs 55.05% in Dec 2025
Half Yearly Results Snapshot (Standalone) - Sep'25
Growth in half year ended Sep 2025 is -59.70% vs -19.06% in Sep 2024
Growth in half year ended Sep 2025 is 17.86% vs 27.27% in Sep 2024
Nine Monthly Results Snapshot (Standalone) - Dec'25
YoY Growth in nine months ended Dec 2025 is -48.03% vs -34.56% in Dec 2024
YoY Growth in nine months ended Dec 2025 is 80.76% vs 80.24% in Dec 2024
Annual Results Snapshot (Standalone) - Mar'26
YoY Growth in year ended Mar 2026 is -34.23% vs -42.63% in Mar 2025
YoY Growth in year ended Mar 2026 is 108.08% vs 27.91% in Mar 2025
About Rhetan TMT Ltd

Company Coordinates


