
 Price Point
Compare Risa Internatio. with Similar Stocks
ScoreDashboard
With a Negative Book Value, the company has a Weak Long Term Fundamental Strength
- The company has a negative book value of Rs 5.10 crore
Flat results in Jun 26
Risky - Negative EBITDA
Mojo ParametersStock DNA

Trading & Distributors

INR 6 Cr (Micro Cap)

NA (Loss Making)
22

0.00%

-1.99

202.16%

-1.25
Total ReturnsTotal Returns (Price + Dividend) 
Latest dividend: 0.09999999999999999 per share ex-dividend date: Aug-21-2014
Risk Adjusted Returns v/s
Returns Beta
 News & Corporate Actions
News
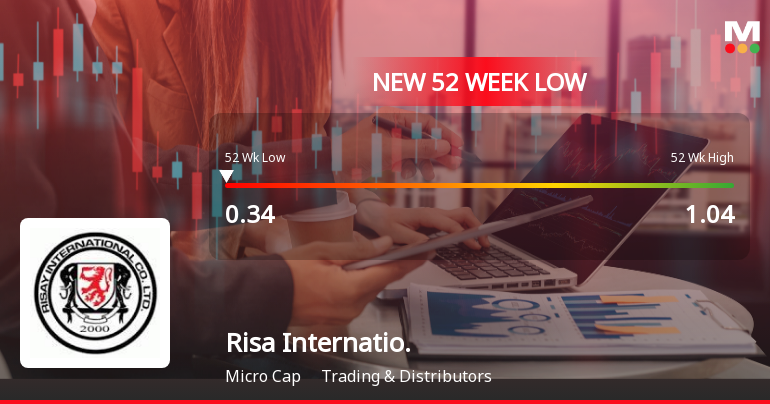
Risa International Ltd Falls to 52-Week Low of Rs 0.34 as Sell-Off Deepens
For the second consecutive session, Risa International Ltd has seen its share price decline sharply, hitting a fresh 52-week low of Rs 0.34 on 19 Aug 2026. This drop comes amid a broader market downturn, but the stock’s underperformance is particularly pronounced, falling 20.93% over the last two days and underperforming its sector by 19% today alone.
Read full news articleAre Risa International Ltd latest results good or bad?
Risa International Ltd's latest financial results highlight a company facing significant operational challenges. In the quarter ending March 2026, the company reported zero net sales, continuing a trend of no revenue generation that has persisted for over seven quarters. The reported net loss for the quarter was ₹0.47 crores, which reflects a widening of losses compared to the previous quarter, although the change was influenced by a one-off tax credit recognized earlier. The company's operating loss stood at ₹0.16 crores, while interest expenses surged to ₹0.31 crores, marking a substantial increase from the previous quarter. This rising interest burden, alongside the absence of any revenue, indicates a deteriorating financial situation. Additionally, Risa International's shareholder equity turned negative at ₹-3.65 crores, signaling technical insolvency as liabilities exceed assets. The balance sheet re...
Read full news article Announcements
Appointment of Company Secretary and Compliance Officer
03-Sep-2026 | Source : BSEAppointment of Company Secretary & Compliance Officer
Announcement under Regulation 30 (LODR)-Newspaper Publication
01-Sep-2026 | Source : BSENewspapers Publication for 32nd Annual General Meeting FY 2025-2026
Notice For 32Nd Annual General Meeting For The Financial Year 2025-2026
31-Aug-2026 | Source : BSENotice for 32nd Annual General Meeting for the financial year 2025-2026
Corporate Actions

No Upcoming Board Meetings

Risa International Ltd has declared 5% dividend, ex-date: 21 Aug 14

Risa International Ltd has announced 2:10 stock split, ex-date: 07 Oct 14

No Bonus history available

No Rights history available
Key FactorsQuality key factors
Valuation key factors
Technicals key factors
 Technical Indicator Scale: Bearish, Mildly Bearish, Sideways, Mildly Bullish, Bullish Turned Shareholding
Shareholding Snapshot : Jun 2026
Shareholding Compare (%holding)
Non Institution
None
Held by 0 Schemes
Held by 1 FIIs (0.24%)
Kotsin Commerce Llp (12.7%)
Hasmukhbhai Manilal Shah (2.69%)
77.84%
FinancialQuarterly Results Snapshot (Standalone) - Jun'26 - QoQ
 Compare with Peers
 QoQ Growth in quarter ended Jun 2026 is 0.00% vs 0.00% in Mar 2026

QoQ Growth in quarter ended Jun 2026 is 14.89% vs 35.62% in Mar 2026

Half Yearly Results Snapshot (Standalone) - Sep'25
Growth in half year ended Sep 2025 is 0.00% vs 0.00% in Sep 2024
Growth in half year ended Sep 2025 is -13.64% vs 98.49% in Sep 2024
Nine Monthly Results Snapshot (Standalone) - Dec'25
YoY Growth in nine months ended Dec 2025 is 0.00% vs 0.00% in Dec 2024
YoY Growth in nine months ended Dec 2025 is -216.13% vs 97.89% in Dec 2024
Annual Results Snapshot (Standalone) - Mar'26
YoY Growth in year ended Mar 2026 is 0.00% vs 0.00% in Mar 2025

YoY Growth in year ended Mar 2026 is 83.89% vs 39.07% in Mar 2025
 Company CV
About Risa International Ltd










