
Compare Rita Finance and with Similar Stocks
Stock DNA
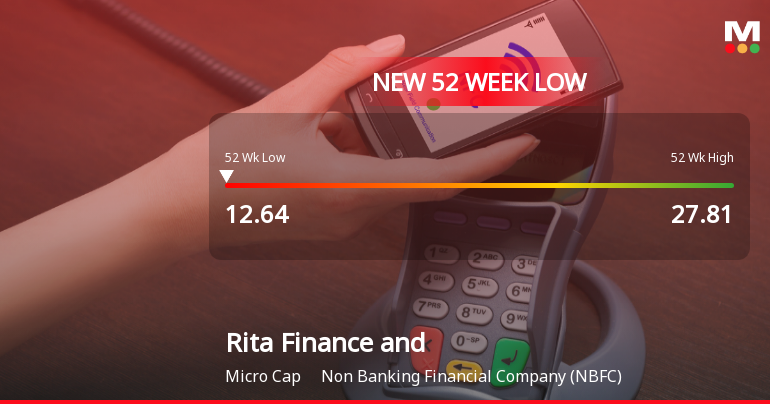
Non Banking Financial Company (NBFC)
INR 14 Cr (Micro Cap)
19.00
21
0.00%
0.19
4.04%
0.82
Total Returns (Price + Dividend) 
Rita Finance and for the last several years.
Risk Adjusted Returns v/s
Returns Beta

News

Rita Finance Q4 FY26: Profit Decline Amid Rising Interest Costs Signals Structural Challenges
Rita Finance and Leasing Ltd., a micro-cap non-banking financial company with a market capitalisation of ₹18.00 crores, reported a sharp 52.00% decline in net profit for Q4 FY26, posting ₹0.12 crores compared to ₹0.25 crores in the previous quarter. The results, announced for the quarter ended March 2026, reveal mounting pressure from interest expenses that surged to ₹0.12 crores from nil in the prior quarter, severely compressing profitability despite revenue growth. The stock traded at ₹17.84 on May 29, 2026, down 0.50% from the previous close, continuing its multi-year underperformance trajectory.
Read full news article Announcements
Announcement under Regulation 30 (LODR)-Resignation of Chief Executive Officer (CEO)
13-Jun-2026 | Source : BSEResignation of Mrs. Jenisha Het Shah from position of Chief Executive Officer of the Company
Reply For Delay In Disclosure Under Regulation 30 Of SEBI (LODR) Regulations 2015- Administrative Warning Letter Received From SEBI
29-May-2026 | Source : BSEReply for delay in disclosure under reg 30 of SEBI (LODR) Regulations 2015
Board Meeting Outcome for Outcome Of The Board Meeting Held On 27Th May 2026
27-May-2026 | Source : BSEPursuant to Regulations 30 of the Securities and Exchange Board of India (Listing Obligations and Disclosure Requirements) Regulations 2015 (Listing Regulations) we wish to inform you that the Board of Directors at its meeting held on 27th May 2026 at the corporate office of the Company inter-alia to considered and approved: 1. Approval of Standalone Audited Financial Result for the Year ended on 31st March 2026 as per Regulation 33 of the SEBI (LODR) Regulations 2015 along with Audit report. 2. Appointed M/s. Shweta Jain & Co LLP (FRN: 127673W/W101149) Chartered Accountants as the Internal Auditor of the Company for the financial year 2026-27. The meeting of the Board of Directors commenced at 04:00 P.M. and concluded at 05:00 P.M
Corporate Actions

No Upcoming Board Meetings

No Dividend history available

No Splits history available

No Bonus history available

No Rights history available
Quality key factors
Valuation key factors
Technicals key factors
 Technical Indicator Scale: Bearish, Mildly Bearish, Sideways, Mildly Bullish, Bullish Turned
 Shareholding Snapshot : Mar 2026
Shareholding Compare (%holding)
Non Institution
77.3174
Held by 0 Schemes
Held by 0 FIIs
Pawan Kumar Mittal (22.34%)
Bhoomi Jitesh Shah (4.14%)
63.55%
Quarterly Results Snapshot (Standalone) - Mar'26 - QoQ

QoQ Growth in quarter ended Mar 2026 is 52.00% vs -24.24% in Dec 2025
QoQ Growth in quarter ended Mar 2026 is -20.00% vs -25.00% in Dec 2025
Half Yearly Results Snapshot (Standalone) - Sep'25
Growth in half year ended Sep 2025 is 27.27% vs -9.84% in Sep 2024
Growth in half year ended Sep 2025 is 61.54% vs -35.00% in Sep 2024
Nine Monthly Results Snapshot (Standalone) - Dec'25
YoY Growth in nine months ended Dec 2025 is 31.94% vs -19.10% in Dec 2024
YoY Growth in nine months ended Dec 2025 is 90.00% vs -47.37% in Dec 2024
Annual Results Snapshot (Standalone) - Mar'26
YoY Growth in year ended Mar 2026 is 29.13% vs -14.88% in Mar 2025

YoY Growth in year ended Mar 2026 is 15.00% vs 50.00% in Mar 2025
About Rita Finance and Leasing Ltd

Company Coordinates


