
Compare Route Mobile with Similar Stocks
Dashboard
The company is Net-Debt Free
Healthy long term growth as Net Sales has grown by an annual rate of 25.67%
Positive results in Mar 26
With ROE of 13.5, it has a Very Attractive valuation with a 1.2 Price to Book Value
Falling Participation by Institutional Investors
Consistent Underperformance against the benchmark over the last 3 years
Stock DNA
Telecom - Services
INR 3,374 Cr (Small Cap)
9.00
20
2.11%
-0.49
13.54%
1.19
Total Returns (Price + Dividend) 
Latest dividend: 3 per share ex-dividend date: Feb-13-2026
Risk Adjusted Returns v/s
Returns Beta

News

Route Mobile Ltd is Rated Hold
Route Mobile Ltd is rated Hold by MarketsMOJO, with this rating last updated on 16 April 2026. However, the analysis and financial metrics presented here reflect the stock’s current position as of 11 June 2026, providing investors with an up-to-date view of the company’s fundamentals, valuation, financial trends, and technical outlook.
Read full news article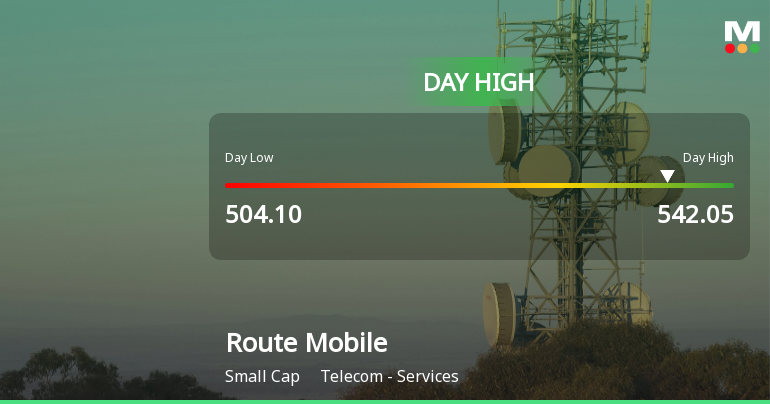
Route Mobile Ltd Surges 7.38% to Day's High of Rs 537.5 — Outperforms Sector by 2.97 Percentage Points
The Sensex edged lower by 0.03% while Route Mobile Ltd surged 7.38% on 02 Jun 2026, reaching an intraday high of Rs 537.5. This 2.97 percentage-point outperformance over the Telecom - Services sector's 3.63% gain highlights a stock-specific strength that rewrites the short-term narrative for this small-cap player.
Read full news article
Route Mobile Ltd is Rated Hold
Route Mobile Ltd is rated 'Hold' by MarketsMOJO, with this rating last updated on 16 Apr 2026. However, the analysis and financial metrics discussed here reflect the stock's current position as of 31 May 2026, providing investors with an up-to-date view of the company’s fundamentals, valuation, financial trends, and technical outlook.
Read full news article Announcements
Compliances-Reg.24(A)-Annual Secretarial Compliance
29-May-2026 | Source : BSEAnnual Secretarial Compliance Report for the year ended March 31 2026.
Announcement under Regulation 30 (LODR)-Change in Management
22-May-2026 | Source : BSEAppointment of M/s. M S K A & Associates LLP as the Statutory Auditors subject to the approval of the shareholders of the Company.
Announcement under Regulation 30 (LODR)-Earnings Call Transcript
15-May-2026 | Source : BSETranscript of Earning Call Q4 & FY26
Corporate Actions

No Upcoming Board Meetings

Route Mobile Ltd has declared 30% dividend, ex-date: 13 Feb 26

No Splits history available

No Bonus history available

No Rights history available
Quality key factors
Valuation key factors
Technicals key factors
 Technical Indicator Scale: Bearish, Mildly Bearish, Sideways, Mildly Bullish, Bullish Turned
 Shareholding Snapshot : Mar 2026
Shareholding Compare (%holding)
Promoters
None
Held by 8 Schemes (3.98%)
Held by 52 FIIs (2.5%)
Proximus Global Sa/nv (previously Known As Proximus Opal Sa/nv) (74.85%)
Sbi Innovative Opportunities Fund (4.98%)
16.19%
Quarterly Results Snapshot (Consolidated) - Mar'26 - QoQ

QoQ Growth in quarter ended Mar 2026 is 2.15% vs -1.10% in Dec 2025

QoQ Growth in quarter ended Mar 2026 is 11.89% vs 560.63% in Dec 2025
Half Yearly Results Snapshot (Consolidated) - Sep'25
Growth in half year ended Sep 2025 is -2.10% vs 11.85% in Sep 2024
Growth in half year ended Sep 2025 is -82.20% vs -0.80% in Sep 2024
Nine Monthly Results Snapshot (Consolidated) - Dec'25
YoY Growth in nine months ended Dec 2025 is -3.63% vs 13.12% in Dec 2024
YoY Growth in nine months ended Dec 2025 is -50.55% vs -8.61% in Dec 2024
Annual Results Snapshot (Consolidated) - Mar'26
YoY Growth in year ended Mar 2026 is -3.66% vs 13.73% in Mar 2025
YoY Growth in year ended Mar 2026 is -25.04% vs -14.99% in Mar 2025
About Route Mobile Ltd

Company Coordinates


