
Compare RPG LifeScience. with Similar Stocks
Stock DNA
Pharmaceuticals & Biotechnology
INR 3,708 Cr (Small Cap)
32.00
33
1.14%
-0.36
18.57%
5.76
Total Returns (Price + Dividend) 
Latest dividend: 4 per share ex-dividend date: Jun-27-2025
Risk Adjusted Returns v/s
Returns Beta

News
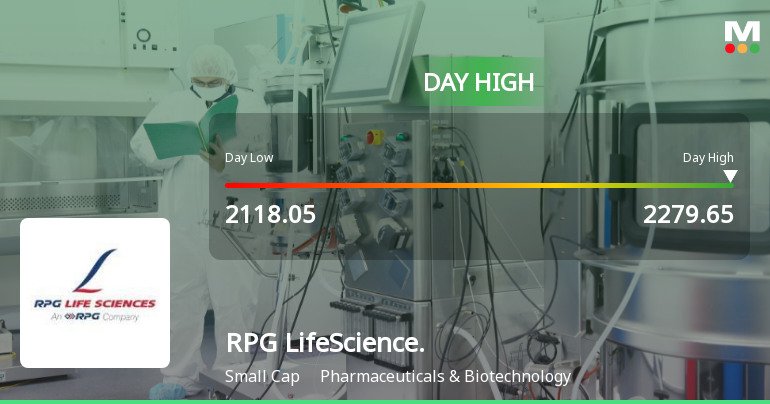
RPG Life Sciences Ltd Surges 7.77% to Day's High of Rs 2278.45 — Outperforms Sector by 6.49 Percentage Points
The Sensex declined by 0.31% on 11 Jun 2026, while RPG Life Sciences Ltd surged 7.77%, marking a notable 6.49-percentage-point outperformance over its Pharmaceuticals & Biotechnology sector. This sharp single-session gain rewrites the short-term narrative for the stock, which has been on a three-day winning streak, accumulating an 8.21% return in that period.
Read full news article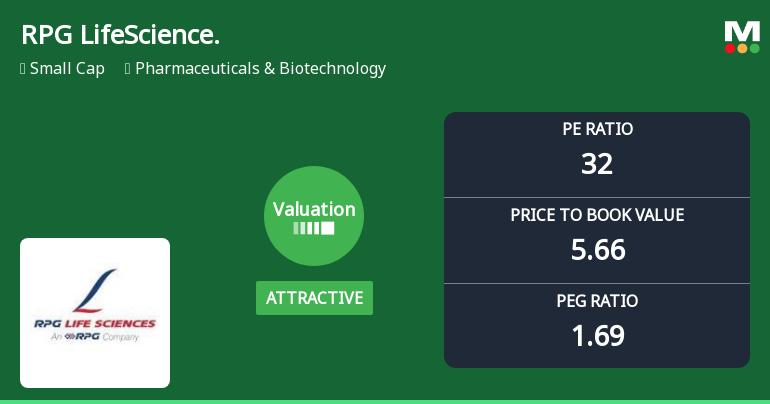
RPG Life Sciences Ltd Valuation Shifts to Attractive Amid Market Pressure
RPG Life Sciences Ltd has seen a notable shift in its valuation parameters, moving from a fair to an attractive rating despite recent share price declines. This change comes amid broader sector challenges and a mixed performance relative to peers, highlighting a potential opportunity for investors seeking value in the Pharmaceuticals & Biotechnology space.
Read full news article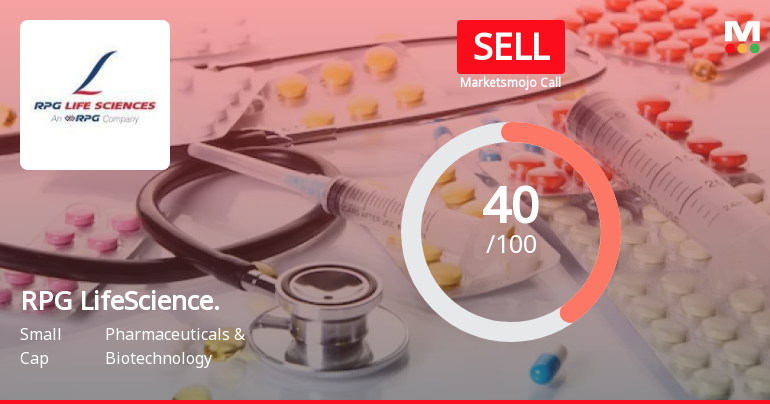
RPG Life Sciences Ltd is Rated Sell
RPG Life Sciences Ltd is rated 'Sell' by MarketsMOJO, with this rating last updated on 11 May 2026. However, the analysis and financial metrics discussed below reflect the stock's current position as of 03 June 2026, providing investors with an up-to-date view of the company’s fundamentals, returns, and market standing.
Read full news article Announcements
Intimation To Shareholders Holding Shares In Physical Form For Furnishing KYC Details
09-Jun-2026 | Source : BSEIntimation to shareholders holding shares in physical form for furnishing KYC details
Communication To Shareholders - Intimation On Dividend Taxation Provisions
09-Jun-2026 | Source : BSECommunication to shareholders - Intimation on dividend Taxation provisions
General Update
03-Jun-2026 | Source : BSEIntimation letter to shareholders regarding transfer of shares to IEPF and newspaper publication.
Corporate Actions

No Upcoming Board Meetings

RPG Life Sciences Ltd has declared 250% dividend, ex-date: 27 Jun 25

No Splits history available

No Bonus history available

No Rights history available
Quality key factors
Valuation key factors
Technicals key factors
 Technical Indicator Scale: Bearish, Mildly Bearish, Sideways, Mildly Bullish, Bullish Turned
 Shareholding Snapshot : Mar 2026
Shareholding Compare (%holding)
Promoters
None
Held by 3 Schemes (0.04%)
Held by 37 FIIs (0.87%)
Nucleus Life Trust (mr. Harsh Vardhan Goenka Is A Trustee) (53.94%)
Clarus Capital I (4.44%)
14.98%
Quarterly Results Snapshot (Standalone) - Mar'26 - QoQ

QoQ Growth in quarter ended Mar 2026 is -1.74% vs -0.91% in Dec 2025

QoQ Growth in quarter ended Mar 2026 is 35.11% vs -39.95% in Dec 2025
Half Yearly Results Snapshot (Standalone) - Sep'25
Growth in half year ended Sep 2025 is 3.84% vs 12.04% in Sep 2024
Growth in half year ended Sep 2025 is 103.94% vs -35.45% in Sep 2024
Nine Monthly Results Snapshot (Standalone) - Dec'25
YoY Growth in nine months ended Dec 2025 is 3.98% vs 12.15% in Dec 2024
YoY Growth in nine months ended Dec 2025 is 29.41% vs -11.46% in Dec 2024
Annual Results Snapshot (Standalone) - Mar'26
YoY Growth in year ended Mar 2026 is 8.28% vs 12.26% in Mar 2025
YoY Growth in year ended Mar 2026 is -37.15% vs 109.03% in Mar 2025
About RPG Life Sciences Ltd

Company Coordinates


