
Compare S I Paper Mills with Similar Stocks
Dashboard
With a growth in Net Profit of 92.83%, the company declared Outstanding results in Mar 26
- The company has declared positive results for the last 4 consecutive quarters
- ROCE(HY) Highest at 9.15%
- DEBT-EQUITY RATIO(HY) Lowest at 0.70 times
- OPERATING PROFIT TO INTEREST(Q) Highest at 2.95 times
With ROCE of 9.1, it has a Very Attractive valuation with a 0.9 Enterprise value to Capital Employed
Majority shareholders : Non Institution
Market Beating Performance
Stock DNA
Paper, Forest & Jute Products
INR 201 Cr (Micro Cap)
18.00
17
0.00%
0.69
4.83%
0.88
Total Returns (Price + Dividend) 
Latest dividend: 1 per share ex-dividend date: Aug-29-2022
Risk Adjusted Returns v/s
Returns Beta

News
Broad-Based Technical Strength Lifts South India Paper Mills Ltd to 52-Week High of Rs 117
Surging to an intraday peak of Rs 117 on 14 Jul 2026, South India Paper Mills Ltd has marked a significant milestone by reaching a fresh 52-week high. This rally, underpinned by a confluence of bullish technical indicators and sustained price momentum, stands out amid a broadly subdued market backdrop.
Read full news article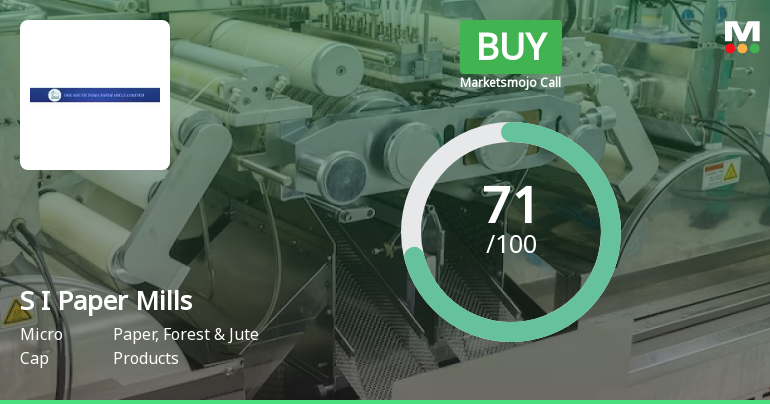
South India Paper Mills Ltd is Rated Buy
South India Paper Mills Ltd is rated 'Buy' by MarketsMOJO, with this rating last updated on 15 June 2026. However, the analysis and financial metrics discussed here reflect the stock's current position as of 08 July 2026, providing investors with the latest insights into the company’s performance and outlook.
Read full news article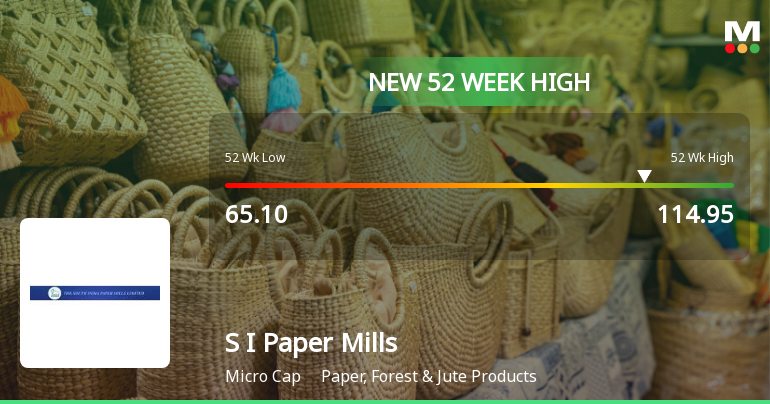
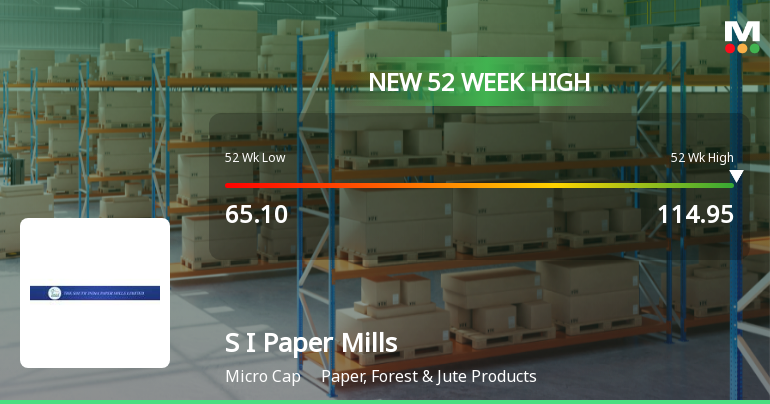
Broad-Based Technical Strength Lifts South India Paper Mills Ltd to 52-Week High of Rs 114.95
With a decisive breakthrough to Rs 114.95 on 1 Jul 2026, South India Paper Mills Ltd has reached a fresh 52-week high, marking a significant milestone in its price momentum. This advance comes amid a backdrop of strong technical signals and sustained earnings growth, setting the stage for a compelling momentum narrative.
Read full news article Announcements
Board Meeting Intimation for Financial Results For The Quarter Ended 30Th June 2026
11-Jul-2026 | Source : BSESouth India Paper Mills Ltdhas informed BSE that the meeting of the Board of Directors of the Company is scheduled on 30/07/2026 inter alia to consider and approve the unaudited financial results for the Quarter ended 30th June 2026.
Compliances-Certificate under Reg. 74 (5) of SEBI (DP) Regulations 2018
11-Jul-2026 | Source : BSESubmission of certificate under Reg 74(5) of SEBI (DP) Regulations 2018
Closure of Trading Window
30-Jun-2026 | Source : BSEIntimation regarding closure of trading window for Q1 Results commencing from 1st July 2026 till the expiry of 48 hours after the declaration of unaudited financial results for the quarter ended 30th June 2026
Corporate Actions

No Upcoming Board Meetings

South India Paper Mills Ltd has declared 10% dividend, ex-date: 29 Aug 22

No Splits history available

South India Paper Mills Ltd has announced 1:1 bonus issue, ex-date: 06 Sep 10

No Rights history available
Quality key factors
Valuation key factors
Technicals key factors
 Technical Indicator Scale: Bearish, Mildly Bearish, Sideways, Mildly Bullish, Bullish Turned
 Shareholding Snapshot : Mar 2026
Shareholding Compare (%holding)
Non Institution
None
Held by 1 Schemes (0.01%)
Held by 0 FIIs
Upendra Ambalal Patel (3.56%)
Harshad Natvarlal Modi (13.55%)
40.24%
Quarterly Results Snapshot (Standalone) - Mar'26 - QoQ

QoQ Growth in quarter ended Mar 2026 is 12.45% vs -9.14% in Dec 2025
QoQ Growth in quarter ended Mar 2026 is 92.83% vs -15.66% in Dec 2025
Half Yearly Results Snapshot (Standalone) - Sep'25

Growth in half year ended Sep 2025 is 14.01% vs 27.96% in Sep 2024
Growth in half year ended Sep 2025 is 193.60% vs 45.94% in Sep 2024
Nine Monthly Results Snapshot (Standalone) - Dec'25
YoY Growth in nine months ended Dec 2025 is 16.23% vs 24.15% in Dec 2024
YoY Growth in nine months ended Dec 2025 is 183.49% vs 30.93% in Dec 2024
Annual Results Snapshot (Standalone) - Mar'26
YoY Growth in year ended Mar 2026 is 17.47% vs 18.25% in Mar 2025
YoY Growth in year ended Mar 2026 is 211.41% vs 28.22% in Mar 2025
About South India Paper Mills Ltd

Company Coordinates


