
Compare Sakar Healthcare with Similar Stocks
Dashboard
With a growth in Net Profit of 91.32%, the company declared Outstanding results in Mar 26
- The company has declared positive results for the last 6 consecutive quarters
- OPERATING PROFIT TO INTEREST(Q) Highest at 10.89 times
- ROCE(HY) Highest at 12.54%
- NET SALES(Q) Highest at Rs 71.10 cr
High Institutional Holdings at 24.27%
Stock DNA
Pharmaceuticals & Biotechnology
INR 1,856 Cr (Micro Cap)
60.00
34
0.00%
0.17
9.39%
5.51
Total Returns (Price + Dividend) 
Sakar Healthcare for the last several years.
Risk Adjusted Returns v/s
Returns Beta

News

Sakar Healthcare Ltd is Rated Buy
Sakar Healthcare Ltd is rated 'Buy' by MarketsMOJO, with this rating last updated on 15 May 2026. However, the analysis and financial metrics discussed here reflect the stock's current position as of 08 June 2026, providing investors with the most up-to-date view of the company’s performance and outlook.
Read full news article
Sakar Healthcare Ltd is Rated Buy
Sakar Healthcare Ltd is rated Buy by MarketsMOJO, with this rating last updated on 15 May 2026. While the rating change occurred on that date, the analysis and financial metrics discussed here reflect the stock’s current position as of 08 June 2026, providing investors with the most up-to-date view of the company’s fundamentals and market performance.
Read full news article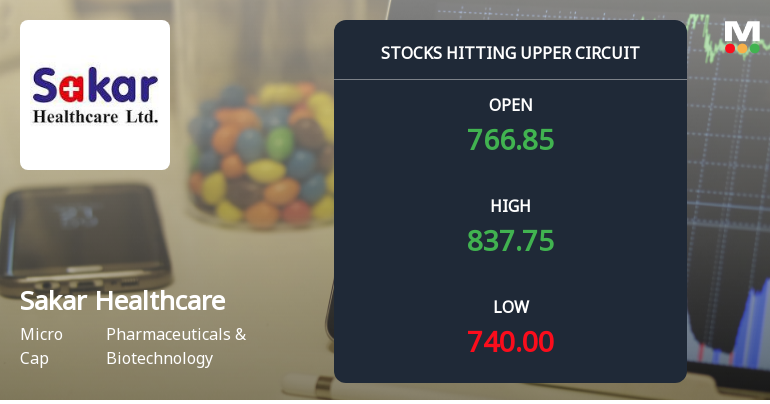
Sakar Healthcare Ltd Locks at Upper Circuit With 6.89% Gain — Buyers Queue, Sellers Absent
At Rs 837.75, the buying was done — not because demand dried up, but because the exchange wouldn't let the stock go any higher. Sakar Healthcare Ltd locked at its upper circuit of 10% on 25 May 2026, with buyers queuing and no sellers willing to part with shares.
Read full news article Announcements
Sakar Healthcare Limited - Reply to Clarification- Financial results
09-Dec-2019 | Source : NSESakar Healthcare Limitedealthcare Limited for the quarter ended 30-Sep-2019 with respect to Regulation 33 of the SEBI (Listing Obligations and Disclosure Requirements) Regulations, 2015.
Sakar Healthcare Limited - Clarification - Financial Results
03-Dec-2019 | Source : NSESakar Healthcare Limitede Limited for the quarter ended 30-Sep-2019 with respect to Regulation 33 of the SEBI (Listing Obligations and Disclosure Requirements) Regulations, 2015.
Sakar Healthcare Limited - Outcome of Board Meeting
14-Nov-2019 | Source : NSESakar Healthcare Limited has informed the Exchange regarding Board meeting held on November 14, 2019.
Corporate Actions

No Upcoming Board Meetings

No Dividend history available

No Splits history available

No Bonus history available

No Rights history available
Quality key factors
Valuation key factors
Technicals key factors
 Technical Indicator Scale: Bearish, Mildly Bearish, Sideways, Mildly Bullish, Bullish Turned
 Shareholding Snapshot : Mar 2026
Shareholding Compare (%holding)
Promoters
None
Held by 0 Schemes
Held by 7 FIIs (12.94%)
Sanjay S Shah (44.98%)
Tata Capital Healthcare Fund Ii (10.38%)
18.11%
Quarterly Results Snapshot (Consolidated) - Mar'26 - YoY

YoY Growth in quarter ended Mar 2026 is 41.52% vs 16.67% in Mar 2025
YoY Growth in quarter ended Mar 2026 is 91.32% vs 84.62% in Mar 2025
Half Yearly Results Snapshot (Consolidated) - Sep'25
Growth in half year ended Sep 2025 is 31.42% vs 14.86% in Sep 2024
Growth in half year ended Sep 2025 is 27.74% vs 11.27% in Sep 2024
Nine Monthly Results Snapshot (Consolidated) - Dec'25
YoY Growth in nine months ended Dec 2025 is 41.85% vs 15.46% in Dec 2024
YoY Growth in nine months ended Dec 2025 is 65.76% vs 37.31% in Dec 2024
Annual Results Snapshot (Consolidated) - Mar'26
YoY Growth in year ended Mar 2026 is 41.76% vs 15.80% in Mar 2025
YoY Growth in year ended Mar 2026 is 74.17% vs 49.96% in Mar 2025
About Sakar Healthcare Ltd

Company Coordinates


