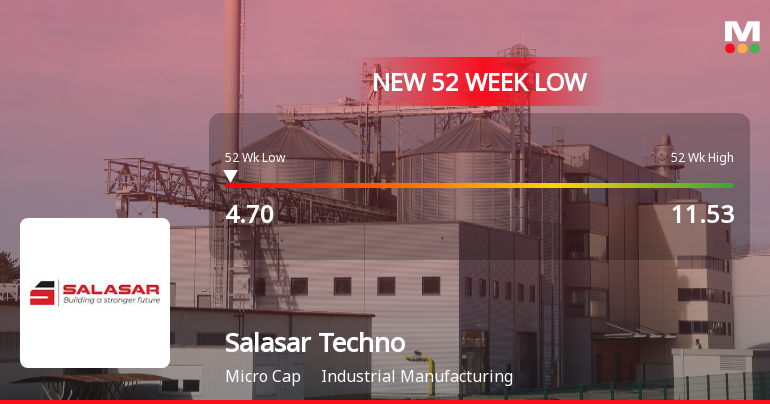
Salasar Techno

  • Market Cap: Micro Cap
  • Industry: Industrial Manufacturing
  • ISIN: INE170V01027
  • NSEID: SALASAR
  • BSEID: 540642
INR
5.88
-0.02 (-0.34%)
BSENSE

Aug 07, 03:30 PM

BSE+NSE Vol: 26.53 lacs

  • Price Points
  • Score
  • Mojo Parameters
  • Total Return
  • News and Corporate Actions
  • Key factors
  • Shareholding
  • Financials
  • CompanyCV
stock-recommendationUpcoming Result: Salasar Techno will declare its result soon on 13 Aug 2026
stock-recommendationMojo Score Change: Salasar Techno has changed its score on 03 Aug 2026. Click here to unlock latest mojo score!
stock-summaryPrice Point
High/Low

1Day

52 Week

Valuation
Technical
Day's Volume

CASH

26.53 lacs (-10.29%) Volume

Shareholding (Jun 2026)

FII

5.90%

Held by 28 FIIs

DII

0.00%

Held by 10 DIIs

Promoter

44.50%

Why is Salasar Techno Engineering Ltd falling/rising?

07-Aug-2026

As of 06-Aug, Salasar Techno Engineering Ltd's stock price is at 5.90, reflecting a recent decline after three days of gains, with significant underperformance over the year. The stock is trading below several moving averages, indicating a bearish trend and decreased investor interest.

As of 06-Aug, Salasar Techno Engineering Ltd's stock price is falling, currently at 5.90, reflecting a decrease of 0.03 or 0.51%. This decline follows a trend reversal after three consecutive days of gains. The stock's performance over the past week shows a slight increase of 0.34%, but it has underperformed significantly over longer periods, with a year-to-date decline of 33.26% and a one-year drop of 15.95%. <BR><BR>Additionally, the stock is currently trading higher than its 5-day moving average but lower than its 20-day, 50-day, 100-day, and 200-day moving averages, indicating a bearish trend in the longer term. Investor participation has also decreased, with delivery volume on 05-Aug falling by 39.51% compared to the 5-day average. This decline in trading activity suggests waning interest among investors, contributing to the stock's downward movement. Overall, these factors indicate that Salasar Techno Engineering Ltd is experiencing a decline in its stock price.

View full answer

When is the next results date for Salasar Techno Engineering Ltd?

07-Aug-2026

The next results date for Salasar Techno Engineering Ltd is 13 August 2026.

The next results date for Salasar Techno Engineering Ltd is scheduled for 13 August 2026.

View full answer

Should I buy, sell or hold Salasar Techno Engineering Ltd?

04-Aug-2026

What does Salasar Techno do?

11-Jun-2026

Salasar Techno Engineering Ltd is a micro-cap industrial manufacturing company, originally founded in 2001, with recent quarterly net sales of 445 Cr and a net profit of -12 Cr as of March 2026. The company has a market cap of INR 1,196 Cr and key financial metrics include a P/E ratio of 69.00 and a debt-equity ratio of 0.45.

Overview:<BR>Salasar Techno Engineering Ltd operates in the industrial manufacturing sector and is categorized as a micro-cap company.<BR><BR>History:<BR>The company was initially incorporated in 2001 as "Salasar Petrochemicals Private Limited" and underwent a name change to "Salasar Techno Engineering Private Limited" in 2006 after being taken over by its promoters in 2005. The latest quarterly results reported net sales and net profit for the period ending March 2026.<BR><BR>Financial Snapshot:<BR>Net Sales: 445 Cr (Quarterly Results - Mar 2026) <BR>Net Profit: -12 Cr (Quarterly Results - Mar 2026) <BR>Market Cap: INR 1,196 Cr (Micro Cap)<BR><BR>Key Metrics:<BR>P/E: 69.00 <BR>Industry P/E: 37 <BR>Dividend Yield: 0.00% <BR>Debt-Equity: 0.45 <BR>Return on Equity: 2.07% <BR>Price to Book: 1.43 <BR><BR>Contact Details:<BR>Address: E-20 South Extension I, New Delhi, New Delhi: 110049 <BR>Tel: 91-11-41648566/8577 <BR>Email: compliance@salasartechno.com <BR>Website: http://www.salasartechno.com

View full answer

How big is Salasar Techno?

11-Jun-2026

As of 10th June, Salasar Techno Engineering Ltd has a market capitalization of 1,196.00 Cr, with net sales of 1,502.77 Cr and a net profit of 17.22 Cr reported in the latest four quarters. The company has shareholder's funds of 785.55 Cr and total assets of 1,725.26 Cr for the annual period ending March 2025.

As of 10th June, Salasar Techno Engineering Ltd has a market capitalization of 1,196.00 Cr, categorizing it as a Micro Cap company.<BR><BR>In the latest four quarters, Salasar Techno reported net sales of 1,502.77 Cr and a net profit of 17.22 Cr.<BR><BR>For the latest annual period ending in March 2025, the company reported shareholder's funds of 785.55 Cr and total assets of 1,725.26 Cr.

View full answer

Who are in the management team of Salasar Techno?

11-Jun-2026

The management team of Salasar Techno includes Alok Kumar (Chairman & Managing Director), Shashank Agarwal (Joint Managing Director), Shalabh Agarwal and Tripti Gupta (Whole-time Directors), and three Independent Directors: Sanjay Chandak, Mukesh Kumar Garg, and Vijay Kumar Jain, along with Mohit Kumar Goel as Company Secretary & Compliance Officer.

The management team of Salasar Techno includes the following individuals:<BR><BR>1. **Alok Kumar** - Chairman & Managing Director<BR>2. **Shashank Agarwal** - Joint Managing Director<BR>3. **Shalabh Agarwal** - Whole-time Director<BR>4. **Tripti Gupta** - Whole-time Director<BR>5. **Sanjay Chandak** - Independent Director<BR>6. **Mukesh Kumar Garg** - Independent Director<BR>7. **Vijay Kumar Jain** - Independent Director<BR>8. **Mohit Kumar Goel** - Company Secretary & Compliance Officer<BR><BR>If you need more details about their roles or the company, feel free to ask!

View full answer

Who are the peers of the Salasar Techno?

11-Jun-2026

Salasar Techno's peers include Disa India, Indian Hume Pipe, Everest Kanto, Gala Precis. Eng, MIC Electronics, Rajoo Engineers, ICE Make Refrig., OBSC Perfection, and Macpower CNC. In terms of management risk, growth, and capital structure, Salasar Techno is rated average, with a 1-year return of -24.52%, better than Indian Hume Pipe but worse than Gala Precis. Eng.

Peers: The peers of Salasar Techno are Disa India, Indian Hume Pipe, Everest Kanto, Gala Precis. Eng, MIC Electronics, Rajoo Engineers, ICE Make Refrig., OBSC Perfection, and Macpower CNC.<BR><BR>Quality Snapshot: Excellent management risk is observed at Disa India, Gala Precis. Eng, Rajoo Engineers, and ICE Make Refrig., while Average management risk is found at Indian Hume Pipe, Everest Kanto, Salasar Techno, MIC Electronics, and the rest. Below Average management risk is noted at MIC Electronics. Growth is Good at Gala Precis. Eng, MIC Electronics, and Rajoo Engineers, while Average growth is seen at Disa India, Indian Hume Pipe, Everest Kanto, Salasar Techno, and the rest. Below Average growth is observed at Indian Hume Pipe and Thejo Engg. Capital Structure is Excellent at Disa India, Gala Precis. Eng, Rajoo Engineers, ICE Make Refrig., and Macpower CNC, while Below Average capital structure is noted at Indian Hume Pipe, Everest Kanto, Salasar Techno, and MIC Electronics.<BR><BR>Return Snapshot: The peer with the highest 1-year return is Gala Precis. Eng at -2.27%, while the peer with the lowest is Indian Hume Pipe at -35.94%. Salasar Techno's own 1-year return is -24.52%, which is better than Indian Hume Pipe but worse than Gala Precis. Eng. Additionally, the six-month return is negative for Indian Hume Pipe, Everest Kanto, Salasar Techno, MIC Electronics, Rajoo Engineers, and Thejo Engg.

View full answer

Are Salasar Techno Engineering Ltd latest results good or bad?

02-Jun-2026

Salasar Techno Engineering Ltd's latest results are concerning, showing an 8% decline in net sales and a net loss of ₹12.49 crores, indicating significant operational challenges and deteriorating margins. Investors should exercise caution due to these financial difficulties.

The latest results for Salasar Techno Engineering Ltd are concerning. In the quarter ending March 2026, the company reported a significant decline in net sales, down 8.00% year-on-year to ₹444.65 crores. More troubling is the net profit, which fell to a loss of ₹12.49 crores, marking a drastic 135.66% decline compared to the same quarter last year.<BR><BR>Operating margins also deteriorated sharply, collapsing to just 3.15% from 5.68% a year earlier. This margin compression is a critical issue, reflecting challenges in cost management and project execution. Additionally, the company's interest coverage ratio has dropped to 0.98 times, indicating that operating profits are insufficient to cover interest expenses, which raises serious concerns about its ability to meet debt obligations.<BR><BR>While there was a sequential revenue increase of 34.42% from the previous quarter, this growth seems to mask deeper operational challenges, as the overall performance remains weak. The volatility in quarterly results and the inability to maintain profitability suggest that the company is grappling with significant operational issues.<BR><BR>Overall, the results can be characterized as bad, highlighting a troubling trajectory for Salasar Techno Engineering Ltd. Investors should approach with caution, considering the ongoing financial and operational challenges.

View full answer

Is Salasar Techno overvalued or undervalued?

04-Dec-2025

As of December 3, 2025, Salasar Techno is considered very attractive and undervalued with a PE ratio of 43.13, an EV to EBITDA of 14.72, and a Price to Book Value of 2.00, indicating growth potential compared to its peers despite a year-to-date return of -34.65%.

As of 3 December 2025, the valuation grade for Salasar Techno has moved from attractive to very attractive, indicating a significant improvement in its perceived value. The company is currently considered undervalued. Key ratios include a PE ratio of 43.13, an EV to EBITDA of 14.72, and a Price to Book Value of 2.00, which suggest that while the company has a high valuation, it may still offer growth potential compared to its peers.<BR><BR>In comparison to its industry peers, Salasar Techno's PE ratio of 43.13 is lower than Thermax's 57.72 and BEML Ltd's 50.15, both of which are categorized as expensive. Additionally, Salasar's EV to EBITDA ratio of 14.72 is more favorable than Thermax's 37.87, reinforcing its valuation appeal. Despite recent stock performance lagging behind the Sensex, particularly with a year-to-date return of -34.65% compared to the Sensex's 8.92%, the fundamental ratios suggest that Salasar Techno may present a compelling investment opportunity moving forward.

View full answer

How has been the historical performance of Salasar Techno?

17-Nov-2025

Salasar Techno has demonstrated significant growth in net sales, increasing from 526.25 Cr in Mar'20 to 1,447.43 Cr in Mar'25, but profitability metrics have fluctuated, with profit after tax dropping from 52.93 Cr in Mar'24 to 19.13 Cr in Mar'25. Total assets rose from 453.52 Cr to 1,725.26 Cr during the same period, while cash flow from operating activities turned negative in Mar'25.

Answer:<BR>The historical performance of Salasar Techno shows a significant growth trajectory in net sales and overall financial metrics over the years.<BR><BR>Breakdown:<BR>Salasar Techno's net sales have increased from 526.25 Cr in Mar'20 to 1,447.43 Cr in Mar'25, demonstrating a consistent upward trend. Total operating income followed a similar pattern, rising from 654.88 Cr in Mar'19 to 1,447.43 Cr in Mar'25. However, total expenditure also grew, reaching 1,334.88 Cr in Mar'25, up from 474.45 Cr in Mar'20. Operating profit (PBDIT) saw fluctuations, peaking at 125.90 Cr in Mar'24 before dropping to 119.81 Cr in Mar'25. Profit before tax was highest in Mar'24 at 72.02 Cr but fell to 39.61 Cr in Mar'25, leading to a profit after tax of 19.13 Cr in Mar'25, down from 52.93 Cr in Mar'24. The company's total assets increased significantly from 453.52 Cr in Mar'20 to 1,725.26 Cr in Mar'25, while total liabilities also rose from 164.27 Cr to 316.02 Cr in the same period. Cash flow from operating activities turned negative in Mar'25 at -5.00 Cr, contrasting with a positive cash flow of 51.00 Cr in Mar'24. Overall, while Salasar Techno has shown growth in sales and assets, profitability metrics have experienced volatility, particularly in the last fiscal year.

View full answer

Is Salasar Techno technically bullish or bearish?

07-Nov-2025

As of November 6, 2025, Salasar Techno shows a mildly bullish trend in the short term due to positive daily moving averages, but longer-term indicators remain bearish, suggesting a cautious approach.

As of 6 November 2025, the technical trend for Salasar Techno has changed from mildly bearish to mildly bullish. The current stance is mildly bullish, driven primarily by the daily moving averages indicating bullish momentum. The weekly MACD and KST also support this bullish outlook. However, the monthly indicators, including MACD and Bollinger Bands, remain bearish, suggesting caution. The lack of clear trends in the Dow Theory and OBV further indicates mixed signals. Overall, while there is a bullish shift in the short term, the longer-term indicators present a more cautious view.

View full answer

Who are the top shareholders of the Salasar Techno?

17-Jul-2025

The top shareholders of Salasar Techno include promoters, with Hill View Infrabuild Limited holding 16.65%, and institutional investors, including 30 Foreign Institutional Investors with a combined 5.21%. Individual investors make up 36.28% of the total shareholding, indicating a diverse ownership structure.

The top shareholders of Salasar Techno include a mix of promoters, institutional investors, and individual investors. The majority of the shares are held by promoters, with Hill View Infrabuild Limited being the largest promoter, holding 16.65%. <BR><BR>In terms of institutional investors, 30 Foreign Institutional Investors (FIIs) collectively hold 5.21% of the company. The highest public shareholder is North Star Opportunities Fund Vcc-bull Value Incorporated Vcc Sub-fund, which holds 2.98%. Additionally, individual investors account for 36.28% of the total shareholding. <BR><BR>Overall, the ownership structure reflects a strong presence of promoters alongside significant individual and institutional investment.

View full answer

What is the bonus history of the Salasar Techno?

06-Jun-2025

Salasar Techno's recent bonus history includes a 4:1 bonus announced for February 1, 2024, and a 1:1 bonus issued on July 14, 2021. This demonstrates the company's commitment to rewarding its shareholders.

Salasar Techno has a notable bonus history. The most recent bonus issue was a 4:1 bonus announced with an ex-date of February 1, 2024. Prior to that, the company issued a 1:1 bonus on July 14, 2021, with the ex-date being July 13, 2021. This reflects the company's commitment to rewarding its shareholders through bonus shares. If you have any more questions about Salasar Techno or need further details, feel free to ask!

View full answer

Has Salasar Techno declared dividend?

06-Jun-2025

Salasar Techno Engineering Ltd has declared a 10% dividend, amounting to 0.1 per share, with an ex-date of September 15, 2023. Despite the dividend, recent total returns show significant declines in price over shorter periods, highlighting potential challenges for investors.

Salasar Techno Engineering Ltd has declared a 10% dividend.<BR><BR>Dividend Details:<BR>- Percentage announced: 10%<BR>- Amount per share: 0.1<BR>- Ex-date: 15 Sep 23<BR><BR>Dividend Yield: 0%<BR><BR>Total Returns by Period:<BR>In the 6-month period, the price return was -44.44%, the dividend return was 0%, resulting in a total return of -44.44%.<BR><BR>For the 1-year period, the price return was -55.29%, the dividend return was 0%, leading to a total return of -55.29%.<BR><BR>Over the 2-year period, the price return was 1.03%, the dividend return was 1.01%, culminating in a total return of 2.04%.<BR><BR>In the 3-year period, the price return was 84.88%, the dividend return was 4.22%, resulting in a total return of 89.1%.<BR><BR>For the 4-year period, the price return was 34.26%, the dividend return was 17.24%, leading to a total return of 51.5%.<BR><BR>In the 5-year period, the price return was 773.79%, the dividend return was 126.44%, culminating in a total return of 900.23%.<BR><BR>Overall, while Salasar Techno has declared a dividend, the recent total returns reflect significant declines in price over shorter periods, indicating potential challenges for investors in the near term despite positive long-term returns.

View full answer
iScoreScore
Click here to find our call on this stock
Strong Sell
Sell
Hold
Buy
Strong Buy

Dashboard

1

Low ability to service debt as the company has a high Debt to EBITDA ratio of 3.76 times

  • Low ability to service debt as the company has a high Debt to EBITDA ratio of 3.76 times
  • The company has been able to generate a Return on Equity (avg) of 7.87% signifying low profitability per unit of shareholders funds
2

Poor long term growth as Operating profit has grown by an annual rate 11.06% of over the last 5 years

 
3

The company has declared negative results for the last 2 consecutive quarters

4

Reducing Promoter Confidence

stock-summaryMojo Parameters

Mojo Parameters

Loading Valuation Snapshot...

Stock DNA

stock-summary
Industry

Industrial Manufacturing

stock-summary
Market cap

INR 1,037 Cr (Micro Cap)

stock-summary
P/E

60.00

stock-summary
Industry P/E

41

stock-summary
Dividend Yield

0.00%

stock-summary
Debt Equity

0.45

stock-summary
Return on Equity

2.07%

stock-summary
Price to Book

1.24

Revenue and Profits:
Net Sales:
445 Cr
(Quarterly Results - Mar 2026)
Net Profit:
-12 Cr
stock-summaryTotal Returns
Total Returns (Price + Dividend) stock-summary
Dividend Yield (0%)
TimePeriod
Price Return
Dividend Return
Total Return
3 Months
-24.71%
0%
-24.71%
6 Months
-28.9%
0%
-28.9%
1 Year
-16.0%
0%
-16.0%
2 Years
-66.55%
0%
-66.55%
3 Years
-41.43%
0.19%
-41.24%
4 Years
7.1%
0.62%
7.72%
5 Years
-9.12%
1.04%
-8.08%

Latest dividend: 0.020007717538105343 per share ex-dividend date: Sep-15-2023

Risk Adjusted Returns v/s stock-summary
Returns Beta
Icon
Beta has not been calculated since enough price history is not available
stock-summaryNews & Corporate Actions

Announcements stock-summary

Board Meeting Intimation for Consideration & Approval Of Standalone & Consolidated Unaudited Financial Results For The Quarter Ended June 30 2026

06-Aug-2026 | Source : BSE

Salasar Techno Engineering Ltdhas informed BSE that the meeting of the Board of Directors of the Company is scheduled on 13/08/2026 inter alia to consider and approve Standalone & Consolidated Unaudited Financial Results for the quarter ended June 30 2026.

Announcement under Regulation 30 (LODR)-Newspaper Publication

03-Aug-2026 | Source : BSE

Please find enclosed copy of newspaper publication relating to Notice of transfer of unclaimed dividend & corresponding shares to the IEPF pertaining to final dividend for FY 2018-19.

Compliances-Certificate under Reg. 74 (5) of SEBI (DP) Regulations 2018

14-Jul-2026 | Source : BSE

Please find enclosed certificate under Reg 74(5) of SEBI (DP) Regulations 2018.

Corporate Actions stock-summary

stock-summary
BOARD MEETING

13 Aug 2026

stock-summary
DIVIDEND

Salasar Techno Engineering Ltd has declared 10% dividend, ex-date: 15 Sep 23

stock-summary
SPLITS

Salasar Techno Engineering Ltd has announced 1:10 stock split, ex-date: 27 Jun 22

stock-summary
BONUS

Salasar Techno Engineering Ltd has announced 4:1 bonus issue, ex-date: 01 Feb 24

stock-summary
RIGHTS

No Rights history available

stock-summaryKey Factors

Quality key factors stock-summary

Factor
Value
Sales Growth (5y)
20.29%
EBIT Growth (5y)
11.06%
EBIT to Interest (avg)
2.31
Debt to EBITDA (avg)
3.15
Net Debt to Equity (avg)
0.45
Sales to Capital Employed (avg)
1.36
Tax Ratio
56.26%
Dividend Payout Ratio
0
Pledged Shares
5.14%
Institutional Holding
5.90%
ROCE (avg)
11.42%
ROE (avg)
7.87%

Valuation key factors

Factor
Value
P/E Ratio
60
Industry P/E
41
Price to Book Value
1.23
EV to EBIT
16.21
EV to EBITDA
12.52
EV to Capital Employed
1.16
EV to Sales
0.94
PEG Ratio
NA
Dividend Yield
NA
ROCE (Latest)
7.16%
ROE (Latest)
2.07%

Technicals key factors

Indicator
Weekly
Monthly
MACD
Bearish
Bearish
RSI
Bullish
No Signal
Bollinger Bands
Mildly Bearish
Mildly Bearish
Moving Averages
Bearish (Daily)
KST
Bearish
Mildly Bullish
Dow Theory
No Trend
No Trend
OBV
No Trend
No Trend
stock-summary Technical Indicator Scale: Bearish, Mildly Bearish, Sideways, Mildly Bullish, Bullish  Turned 
stock-summaryShareholding
Shareholding Snapshot : Jun 2026stock-summary
Shareholding Compare (%holding) stock-summary
Majority shareholders

Non Institution

Pledged Promoter Holdings

5.1429

Mutual Funds

Held by 0 Schemes

FIIs

Held by 28 FIIs (5.9%)

Promoter with highest holding

Hill View Infrabuild Limited (16.44%)

Highest Public shareholder

Maybank Securities Pte Ltd - Odi (1.87%)

Individual Investors Holdings

42.05%

stock-summaryFinancial
[
  {
    "link": "quarterly",
    "btn_text": "All Quarterly Results",
    "header": "Quarterly Results Snapshot (Consolidated) - Mar'26 - YoY",
    "rhs": [
      {
        "prefix": "Net Sales ",
        "suffix": "YoY Growth in quarter ended Mar 2026 is -8.00% vs 31.57% in Mar 2025",
        "dir": -1
      },
      {
        "prefix": "Consolidated Net Profit ",
        "suffix": "YoY Growth in quarter ended Mar 2026 is -135.66% vs -131.23% in Mar 2025",
        "dir": -1
      }
    ],
    "table": {
      "header": [
        "Mar'26",
        "Mar'25",
        "Change(%)"
      ],
      "body": [
        {
          "field": "Net Sales",
          "val1": "444.65",
          "val2": "483.31",
          "chgp": "-8.00%",
          "chgp_class": "negative"
        },
        {
          "field": "Operating Profit (PBDIT) excl Other Income",
          "val1": "13.99",
          "val2": "27.45",
          "chgp": "-49.03%",
          "chgp_class": "negative"
        },
        {
          "field": "Interest",
          "val1": "14.30",
          "val2": "13.86",
          "chgp": "3.17%",
          "chgp_class": "negative"
        },
        {
          "field": "Exceptional Items",
          "val1": "0.00",
          "val2": "-6.56",
          "chgp": "100.00%",
          "chgp_class": "positive"
        },
        {
          "field": "Consolidate Net Profit",
          "val1": "-12.49",
          "val2": "-5.30",
          "chgp": "-135.66%",
          "chgp_class": "negative"
        },
        {
          "field": "Operating Profit Margin (Excl OI)",
          "val1": "3.15%",
          "val2": "5.68%",
          "chgp": "-2.53%",
          "chgp_class": "negative"
        }
      ]
    }
  },
  {
    "link": "half-yearly",
    "btn_text": "All Half Yearly Results",
    "header": "Half Yearly Results Snapshot (Consolidated) - Sep'25",
    "rhs": [
      {
        "prefix": "Net Sales ",
        "suffix": " Growth in half year ended Sep 2025 is 26.39% vs 7.13% in Sep 2024",
        "dir": 1
      },
      {
        "prefix": "Consolidated Net Profit ",
        "suffix": " Growth in half year ended Sep 2025 is 20.91% vs 4.64% in Sep 2024",
        "dir": 1
      }
    ],
    "table": {
      "header": [
        "Sep'25",
        "Sep'24",
        "Change(%)"
      ],
      "body": [
        {
          "field": "Net Sales",
          "val1": "727.34",
          "val2": "575.49",
          "chgp": "26.39%",
          "chgp_class": "positive"
        },
        {
          "field": "Operating Profit (PBDIT) excl Other Income",
          "val1": "71.83",
          "val2": "53.86",
          "chgp": "33.36%",
          "chgp_class": "positive"
        },
        {
          "field": "Interest",
          "val1": "26.93",
          "val2": "23.89",
          "chgp": "12.72%",
          "chgp_class": "negative"
        },
        {
          "field": "Exceptional Items",
          "val1": "0.00",
          "val2": "0.00",
          "chgp": "",
          "chgp_class": "neutral"
        },
        {
          "field": "Consolidate Net Profit",
          "val1": "24.29",
          "val2": "20.09",
          "chgp": "20.91%",
          "chgp_class": "positive"
        },
        {
          "field": "Operating Profit Margin (Excl OI)",
          "val1": "9.88%",
          "val2": "9.36%",
          "chgp": "0.52%",
          "chgp_class": "positive"
        }
      ]
    }
  },
  {
    "link": "nine-monthly",
    "btn_text": "All Nine Monthly Results",
    "header": "Nine Monthly Results Snapshot (Consolidated) - Dec'25",
    "rhs": [
      {
        "prefix": "Net Sales ",
        "suffix": "YoY Growth in nine months ended Dec 2025 is 11.30% vs 13.03% in Dec 2024",
        "dir": -1
      },
      {
        "prefix": "Consolidated Net Profit ",
        "suffix": "YoY Growth in nine months ended Dec 2025 is -7.59% vs -10.60% in Dec 2024",
        "dir": 1
      }
    ],
    "table": {
      "header": [
        "Dec'25",
        "Dec'24",
        "Change(%)"
      ],
      "body": [
        {
          "field": "Net Sales",
          "val1": "1,058.12",
          "val2": "950.67",
          "chgp": "11.30%",
          "chgp_class": "positive"
        },
        {
          "field": "Operating Profit (PBDIT) excl Other Income",
          "val1": "98.33",
          "val2": "85.57",
          "chgp": "14.91%",
          "chgp_class": "positive"
        },
        {
          "field": "Interest",
          "val1": "41.30",
          "val2": "36.97",
          "chgp": "11.71%",
          "chgp_class": "negative"
        },
        {
          "field": "Exceptional Items",
          "val1": "0.00",
          "val2": "0.00",
          "chgp": "",
          "chgp_class": "neutral"
        },
        {
          "field": "Consolidate Net Profit",
          "val1": "29.71",
          "val2": "32.15",
          "chgp": "-7.59%",
          "chgp_class": "negative"
        },
        {
          "field": "Operating Profit Margin (Excl OI)",
          "val1": "9.29%",
          "val2": "9.00%",
          "chgp": "0.29%",
          "chgp_class": "positive"
        }
      ]
    }
  },
  {
    "link": "annual",
    "btn_text": "All Annual Results",
    "header": "Annual Results Snapshot (Consolidated) - Mar'26",
    "rhs": [
      {
        "prefix": "Net Sales ",
        "suffix": "YoY Growth in year ended Mar 2026 is 3.82% vs 19.78% in Mar 2025",
        "dir": -1
      },
      {
        "prefix": "Consolidated Net Profit ",
        "suffix": "YoY Growth in year ended Mar 2026 is -9.84% vs -63.91% in Mar 2025",
        "dir": 1
      }
    ],
    "table": {
      "header": [
        "Mar'26",
        "Mar'25",
        "Change(%)"
      ],
      "body": [
        {
          "field": "Net Sales",
          "val1": "1,502.77",
          "val2": "1,447.43",
          "chgp": "3.82%",
          "chgp_class": "positive"
        },
        {
          "field": "Operating Profit (PBDIT) excl Other Income",
          "val1": "112.33",
          "val2": "112.55",
          "chgp": "-0.20%",
          "chgp_class": "negative"
        },
        {
          "field": "Interest",
          "val1": "55.60",
          "val2": "51.83",
          "chgp": "7.27%",
          "chgp_class": "negative"
        },
        {
          "field": "Exceptional Items",
          "val1": "0.00",
          "val2": "-8.95",
          "chgp": "100.00%",
          "chgp_class": "positive"
        },
        {
          "field": "Consolidate Net Profit",
          "val1": "17.22",
          "val2": "19.10",
          "chgp": "-9.84%",
          "chgp_class": "negative"
        },
        {
          "field": "Operating Profit Margin (Excl OI)",
          "val1": "7.47%",
          "val2": "7.78%",
          "chgp": "-0.31%",
          "chgp_class": "negative"
        }
      ]
    }
  }
]

Quarterly Results Snapshot (Consolidated) - Mar'26 - YoYstock-summary

Mar'26
Mar'25
Change(%)
Net Sales
444.65
483.31
-8.00%
Operating Profit (PBDIT) excl Other Income
13.99
27.45
-49.03%
Interest
14.30
13.86
3.17%
Exceptional Items
0.00
-6.56
100.00%
Consolidate Net Profit
-12.49
-5.30
-135.66%
Operating Profit Margin (Excl OI)
3.15%
5.68%
-2.53%
Values in Rs Cr.
Direction Arrows
Net Sales

YoY Growth in quarter ended Mar 2026 is -8.00% vs 31.57% in Mar 2025

Direction Arrows
Consolidated Net Profit

YoY Growth in quarter ended Mar 2026 is -135.66% vs -131.23% in Mar 2025

Half Yearly Results Snapshot (Consolidated) - Sep'25stock-summary

Sep'25
Sep'24
Change(%)
Net Sales
727.34
575.49
26.39%
Operating Profit (PBDIT) excl Other Income
71.83
53.86
33.36%
Interest
26.93
23.89
12.72%
Exceptional Items
0.00
0.00
Consolidate Net Profit
24.29
20.09
20.91%
Operating Profit Margin (Excl OI)
9.88%
9.36%
0.52%
Values in Rs Cr.
Direction Arrows
Net Sales

Growth in half year ended Sep 2025 is 26.39% vs 7.13% in Sep 2024

Direction Arrows
Consolidated Net Profit

Growth in half year ended Sep 2025 is 20.91% vs 4.64% in Sep 2024

Nine Monthly Results Snapshot (Consolidated) - Dec'25stock-summary

Dec'25
Dec'24
Change(%)
Net Sales
1,058.12
950.67
11.30%
Operating Profit (PBDIT) excl Other Income
98.33
85.57
14.91%
Interest
41.30
36.97
11.71%
Exceptional Items
0.00
0.00
Consolidate Net Profit
29.71
32.15
-7.59%
Operating Profit Margin (Excl OI)
9.29%
9.00%
0.29%
Values in Rs Cr.
Direction Arrows
Net Sales

YoY Growth in nine months ended Dec 2025 is 11.30% vs 13.03% in Dec 2024

Direction Arrows
Consolidated Net Profit

YoY Growth in nine months ended Dec 2025 is -7.59% vs -10.60% in Dec 2024

Annual Results Snapshot (Consolidated) - Mar'26stock-summary

Mar'26
Mar'25
Change(%)
Net Sales
1,502.77
1,447.43
3.82%
Operating Profit (PBDIT) excl Other Income
112.33
112.55
-0.20%
Interest
55.60
51.83
7.27%
Exceptional Items
0.00
-8.95
100.00%
Consolidate Net Profit
17.22
19.10
-9.84%
Operating Profit Margin (Excl OI)
7.47%
7.78%
-0.31%
Values in Rs Cr.
Direction Arrows
Net Sales

YoY Growth in year ended Mar 2026 is 3.82% vs 19.78% in Mar 2025

Direction Arrows
Consolidated Net Profit

YoY Growth in year ended Mar 2026 is -9.84% vs -63.91% in Mar 2025

stock-summaryCompany CV
About Salasar Techno Engineering Ltd stock-summary
stock-summary
Salasar Techno Engineering Ltd
Micro Cap
Industrial Manufacturing
Salasar Techno Engineering Limited was initially incorporated as "Salasar Petrochemicals Private Limited" vide Certificate of Incorporation dated October 24, 2001 in Jaipur, Rajasthan. Thereafter, Company was taken over by Promoters in March, 2005. Further the name of the Company changed from "Salasar Petrochemicals Private Limited" to "Salasar Techno Engineering Private Limited" dated June 13, 2006.
Company Coordinates stock-summary
Company Details
E-20 South Extension I , New Delhi New Delhi : 110049
stock-summary
Tel: 91-11-41648566/8577
stock-summary
compliance@salasartechno.com
Registrar Details
Bigshare Services Pvt Ltd , E-2 , Ansa Industrial Estate, Saki Vihar Road, Saki Naka, Andheri (E), Mumbai