
Compare Samyak Internati with Similar Stocks
Dashboard
Weak Long Term Fundamental Strength with an average Return on Equity (ROE) of 6.69%
- Poor long term growth as Operating profit has grown by an annual rate of 7.57%
Flat results in Mar 26
With ROE of -1.7, it has a Very Expensive valuation with a 0.3 Price to Book Value
Underperformed the market in the last 1 year
Stock DNA
Diversified Commercial Services
INR 15 Cr (Micro Cap)
NA (Loss Making)
21
0.00%
0.03
-1.66%
0.26
Total Returns (Price + Dividend) 
Samyak Internati for the last several years.
Risk Adjusted Returns v/s
Returns Beta

News
Are Samyak International Ltd latest results good or bad?
The latest financial results for Samyak International Ltd for the quarter ending March 2026 reveal significant operational challenges. The company reported a standalone net loss of ₹2.44 crores, which is a notable decline from the previous year's loss of ₹1.66 crores. This indicates a worsening financial position, as the company continues to struggle with profitability. Net sales for the quarter were ₹10.41 crores, reflecting a sequential decline of 24.51% from ₹13.79 crores in the previous quarter. This drop in revenue is concerning, as it marks one of the lowest quarterly revenues in the past eight quarters and is significantly below the trailing four-quarter average. The operating margin stood at just 0.96%, which, while slightly improved from 0.74% year-on-year, remains alarmingly low compared to previous periods, highlighting ongoing issues with cost management and operational efficiency. The average...
Read full news article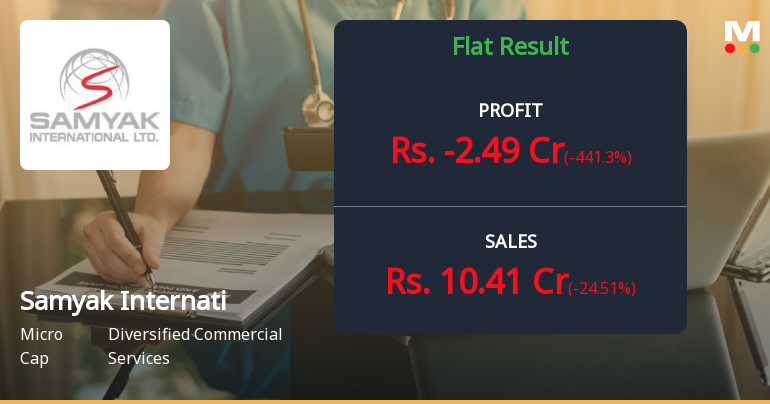
Samyak International Q4 FY26: Losses Deepen as Revenue Contracts Sharply
Samyak International Ltd., a micro-cap diversified commercial services company with a market capitalisation of ₹13.00 crores, reported deeply concerning results for Q4 FY26 ended March 2026, with consolidated net losses widening to ₹2.49 crores from ₹3.58 crores in the year-ago period. The stock, currently trading at ₹14.86, has plunged 60.65% over the past year, reflecting investor exodus amid deteriorating fundamentals and persistent operational challenges.
Read full news articleAre Samyak International Ltd latest results good or bad?
The latest financial results for Samyak International Ltd for Q3 FY26 present a complex picture. The company reported a consolidated net sales figure of ₹13.79 crores, reflecting a quarter-on-quarter growth of 48.60% from ₹9.28 crores in the previous quarter. This growth is notable, as it also marks a year-on-year increase of 62.24% compared to ₹8.50 crores in Q3 FY25. However, this revenue growth is overshadowed by significant operational challenges. The company experienced a net loss of ₹0.46 crores in Q3 FY26, a stark contrast to the profit of ₹0.95 crores reported in Q2 FY26. This represents a substantial decline in profitability, with the operating profit before depreciation, interest, tax, and other income (PBDIT excluding other income) collapsing to a loss of ₹2.14 crores from a profit of ₹1.90 crores in the preceding quarter. Consequently, the operating margin fell sharply to -15.52%, down from 20....
Read full news article Announcements
Announcement under Regulation 30 (LODR)-Newspaper Publication
17-Jun-2026 | Source : BSESubmission of Newspaper Publication dated 17.06.2026 regarding completion of sending of EGM Notice to Shareholders of the Company and E-voting Information.
Submission Of Notice Of Extra-Ordinary General Meeting (EGM).
16-Jun-2026 | Source : BSESubmission of Notice of EGM schedule to be held on Thursday July 09 2026 at 05:00 P.M. through VC/OAVM.
Announcement under Regulation 30 (LODR)-Newspaper Publication
15-Jun-2026 | Source : BSESubmission of Newspaper Advertisement related to Notice of Extra-Ordinary General Meeting to be held through Video Conferencing (VC)/ Other Audio-Visual Means (OAVM).
Corporate Actions

No Upcoming Board Meetings

No Dividend history available

No Splits history available

No Bonus history available

No Rights history available
Quality key factors
Valuation key factors
Technicals key factors
 Technical Indicator Scale: Bearish, Mildly Bearish, Sideways, Mildly Bullish, Bullish Turned
 Shareholding Snapshot : Mar 2026
Shareholding Compare (%holding)
Non Institution
None
Held by 0 Schemes
Held by 0 FIIs
Samyak Jain (5.54%)
Venkata Subbarao Bommisetty (10.04%)
71.52%
Quarterly Results Snapshot (Consolidated) - Mar'26 - QoQ

QoQ Growth in quarter ended Mar 2026 is -24.51% vs 48.60% in Dec 2025
QoQ Growth in quarter ended Mar 2026 is -441.30% vs -148.42% in Dec 2025
Half Yearly Results Snapshot (Consolidated) - Sep'25
Growth in half year ended Sep 2025 is -6.74% vs 14.96% in Sep 2024
Growth in half year ended Sep 2025 is -65.50% vs -15.81% in Sep 2024
Nine Monthly Results Snapshot (Consolidated) - Dec'25
YoY Growth in nine months ended Dec 2025 is 14.24% vs 17.89% in Dec 2024
YoY Growth in nine months ended Dec 2025 is -90.52% vs -8.18% in Dec 2024
Annual Results Snapshot (Consolidated) - Mar'26
YoY Growth in year ended Mar 2026 is 2.05% vs 8.80% in Mar 2025

YoY Growth in year ended Mar 2026 is 340.00% vs -102.63% in Mar 2025
About Samyak International Ltd

Company Coordinates


