
Compare Sanmit Infra with Similar Stocks
Dashboard
Strong ability to service debt as the company has a low Debt to EBITDA ratio of 2.64 times
Poor long term growth as Net Sales has grown by an annual rate of 3.73% and Operating profit at 5.08% over the last 5 years
Flat results in Mar 26
With ROCE of 5.8, it has a Fair valuation with a 2 Enterprise value to Capital Employed
Majority shareholders : Promoters
Market Beating Performance
Total Returns (Price + Dividend) 
Latest dividend: 0.03 per share ex-dividend date: Sep-20-2024
Risk Adjusted Returns v/s
Returns Beta

News
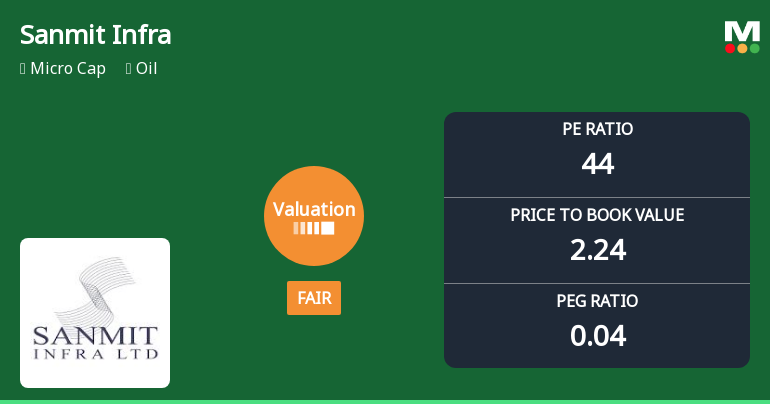
Sanmit Infra Ltd Valuation Shifts to Fair Amid Strong Price Gains
Sanmit Infra Ltd has witnessed a notable shift in its valuation parameters, moving from an attractive to a fair rating as its price-to-earnings (P/E) and price-to-book value (P/BV) ratios have risen sharply. This change comes amid a remarkable rally that has seen the stock outperform the Sensex by a wide margin over multiple time horizons, prompting investors to reassess its price attractiveness within the oil sector.
Read full news article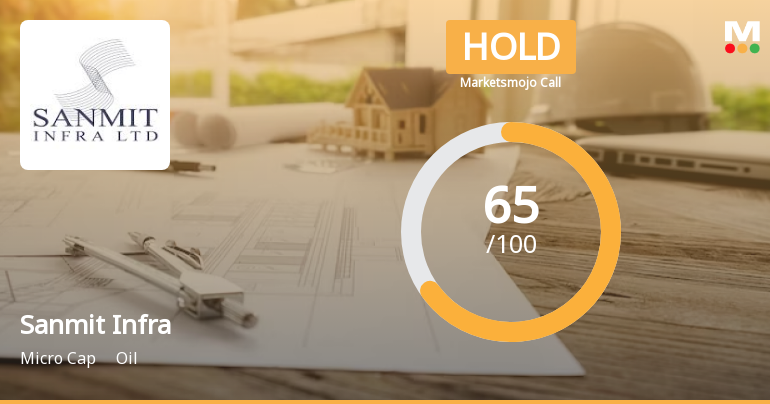
Sanmit Infra Ltd is Rated Hold by MarketsMOJO
Sanmit Infra Ltd is rated 'Hold' by MarketsMOJO, with this rating last updated on 29 May 2026. While the rating change occurred on that date, the analysis and financial metrics discussed here reflect the stock's current position as of 17 June 2026, providing investors with an up-to-date view of the company’s fundamentals, returns, and market standing.
Read full news article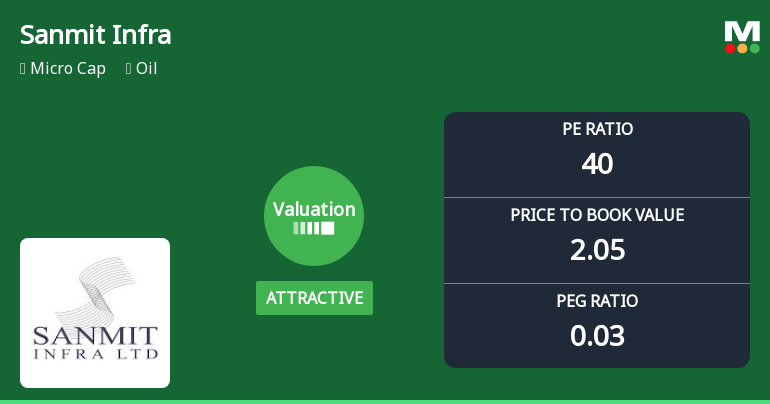
Sanmit Infra Ltd Valuation Shifts Signal Renewed Price Attractiveness Amid Market Volatility
Sanmit Infra Ltd has witnessed a notable shift in its valuation parameters, moving from a fair to an attractive valuation grade, reflecting a significant change in price attractiveness for investors. Despite a recent 5.00% decline in its share price, the micro-cap oil sector company’s price-to-earnings (P/E) and price-to-book value (P/BV) ratios suggest a more compelling entry point compared to its historical averages and peer group.
Read full news article Announcements
Announcement under Regulation 30 (LODR)-Resignation of Statutory Auditors
19-Jun-2026 | Source : BSEEnclosed Herewith Resignation of Statutory Auditor along with Annexure A
Announcement under Regulation 30 (LODR)-Resignation of Statutory Auditors
13-Jun-2026 | Source : BSEEnclosed herewith Announcement under Reg 30 of SEBI (LODR) 2015 relating to Resignation of Statutory Auditor
Announcement under Regulation 30 (LODR)-Resignation of Director
13-Jun-2026 | Source : BSEENCLOSED HEREWITH RESIGNATION OF MR. AJAY N CHANDWANI AS A NON EXECUTIVE INDEPENDENT DIRECTOR W.E.F. 13/06/2026
Corporate Actions

No Upcoming Board Meetings

Sanmit Infra Ltd has declared 3% dividend, ex-date: 20 Sep 24

Sanmit Infra Ltd has announced 10:1 stock split, ex-date: 30 Apr 26

No Bonus history available

No Rights history available
Quality key factors
Valuation key factors
Technicals key factors
 Technical Indicator Scale: Bearish, Mildly Bearish, Sideways, Mildly Bullish, Bullish Turned
 Shareholding Snapshot : Mar 2026
Shareholding Compare (%holding)
Promoters
None
Held by 0 Schemes
Held by 0 FIIs
Kamal K Makhija (17.96%)
Poonam Vishnu Rupani (1.74%)
22.25%
Quarterly Results Snapshot (Standalone) - Mar'26 - QoQ

QoQ Growth in quarter ended Mar 2026 is 36.51% vs 227.02% in Dec 2025

QoQ Growth in quarter ended Mar 2026 is 200.00% vs 147.01% in Dec 2025
Half Yearly Results Snapshot (Standalone) - Sep'25
Growth in half year ended Sep 2025 is -26.23% vs 22.52% in Sep 2024
Growth in half year ended Sep 2025 is 40.54% vs -123.57% in Sep 2024
Nine Monthly Results Snapshot (Standalone) - Dec'25
YoY Growth in nine months ended Dec 2025 is -29.35% vs 35.97% in Dec 2024
YoY Growth in nine months ended Dec 2025 is 1,200.00% vs -100.76% in Dec 2024
Annual Results Snapshot (Standalone) - Mar'26
YoY Growth in year ended Mar 2026 is -29.53% vs 51.73% in Mar 2025
YoY Growth in year ended Mar 2026 is 26.92% vs -65.10% in Mar 2025
About Sanmit Infra Ltd

Company Coordinates


