
Compare Saptak Chem & with Similar Stocks
Dashboard
With a Negative Book Value, the company has a Weak Long Term Fundamental Strength
- Poor long term growth as Net Sales has grown by an annual rate of % and Operating profit at 0% over the last 5 years
- The company has a negative book value of Rs 2.34 crore
Flat results in Mar 26
Risky - Negative EBITDA
Stock DNA
Trading & Distributors
INR 12 Cr (Micro Cap)
573.00
23
0.00%
-1.05
-0.43%
-5.16
Total Returns (Price + Dividend) 
Saptak Chem & for the last several years.
Risk Adjusted Returns v/s
Returns Beta

News
Are Saptak Chem & Business Ltd latest results good or bad?
The latest financial results for Saptak Chem & Business Ltd. indicate a challenging operational environment. In Q4 FY26, the company reported a net loss of ₹0.12 crores, which reflects a continuation of losses without any offsetting revenue, as net sales remained at ₹0.00 crores for the fourth consecutive quarter. This marks a significant period of operational inactivity, with the company having recorded no sales since FY19. The operating loss for the quarter was slightly worse than the previous quarter, indicating a pattern of consistent financial distress. The company's book value per share stands at ₹-2.10, highlighting negative shareholder equity and a lack of meaningful assets. The balance sheet reveals total current assets of only ₹0.14 crores, with liabilities significantly exceeding this amount, resulting in a negative net worth. Moreover, the shareholding pattern shows a decline in promoter comm...
Read full news article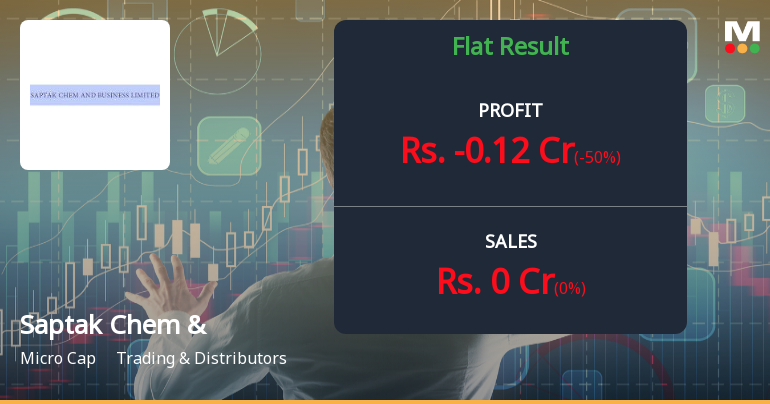
Saptak Chem & Business Ltd: A Dormant Trading Company with Zero Revenue and Mounting Losses
Saptak Chem & Business Ltd., a micro-cap trading company with a market capitalisation of ₹13.00 crores, continues to report zero revenue for yet another quarter, with losses deepening to ₹0.12 crores in Q4 FY26. The company, which once operated in agricultural produce and chemical trading, has been effectively dormant since FY19, when it last recorded sales of ₹1.00 crore. Trading at ₹43.01 per share as of May 15, 2026, the stock has declined 1.98% in the latest session, reflecting persistent investor scepticism about a business that has ceased operations entirely.
Read full news article Announcements
Compliances-Certificate under Reg. 74 (5) of SEBI (DP) Regulations 2018
13-Jul-2026 | Source : BSEReg 74(5)
Board Meeting Outcome for Change In Registered Office Of The Company
25-Jun-2026 | Source : BSEChange in Registered Office of the Company
Closure of Trading Window
25-Jun-2026 | Source : BSEClosure of Trading Window
Corporate Actions

No Upcoming Board Meetings

No Dividend history available

No Splits history available

No Bonus history available

No Rights history available
Quality key factors
Valuation key factors
Technicals key factors
 Technical Indicator Scale: Bearish, Mildly Bearish, Sideways, Mildly Bullish, Bullish Turned
 Shareholding Snapshot : Jun 2026
Shareholding Compare (%holding)
Non Institution
None
Held by 0 Schemes
Held by 0 FIIs
Alpha Antibiotics Limited (12.58%)
Saptak Chem (24.13%)
32.56%
Quarterly Results Snapshot (Standalone) - Mar'26 - YoY
YoY Growth in quarter ended Mar 2026 is 0.00% vs 0.00% in Mar 2025

YoY Growth in quarter ended Mar 2026 is -50.00% vs -166.67% in Mar 2025
Half Yearly Results Snapshot (Standalone) - Sep'25
Growth in half year ended Sep 2025 is 0.00% vs 0.00% in Sep 2024

Growth in half year ended Sep 2025 is -700.00% vs 0.00% in Sep 2024
Nine Monthly Results Snapshot (Standalone) - Dec'25
YoY Growth in nine months ended Dec 2025 is 0.00% vs 0.00% in Dec 2024
YoY Growth in nine months ended Dec 2025 is -1,800.00% vs 0.00% in Dec 2024
Annual Results Snapshot (Standalone) - Mar'26
YoY Growth in year ended Mar 2026 is 0.00% vs 0.00% in Mar 2025
YoY Growth in year ended Mar 2026 is -233.33% vs -200.00% in Mar 2025
About Saptak Chem & Business Ltd

Company Coordinates


