
Compare Sarveshwar Foods with Similar Stocks
Dashboard
Low ability to service debt as the company has a high Debt to EBITDA ratio of 3.81 times
- Low ability to service debt as the company has a high Debt to EBITDA ratio of 3.81 times
- The company has been able to generate a Return on Equity (avg) of 6.45% signifying low profitability per unit of shareholders funds
Flat results in Mar 26
Underperformed the market in the last 1 year
Stock DNA
Other Agricultural Products
INR 429 Cr (Micro Cap)
13.00
45
0.00%
0.52
6.66%
0.88
Total Returns (Price + Dividend) 
Sarveshwar Foods for the last several years.
Risk Adjusted Returns v/s
Returns Beta

News

Sarveshwar Foods Ltd is Rated Sell
Sarveshwar Foods Ltd is rated 'Sell' by MarketsMOJO, with this rating last updated on 06 June 2026. However, the analysis and financial metrics discussed here reflect the stock's current position as of 12 June 2026, providing investors with an up-to-date view of the company’s fundamentals, returns, and market performance.
Read full news article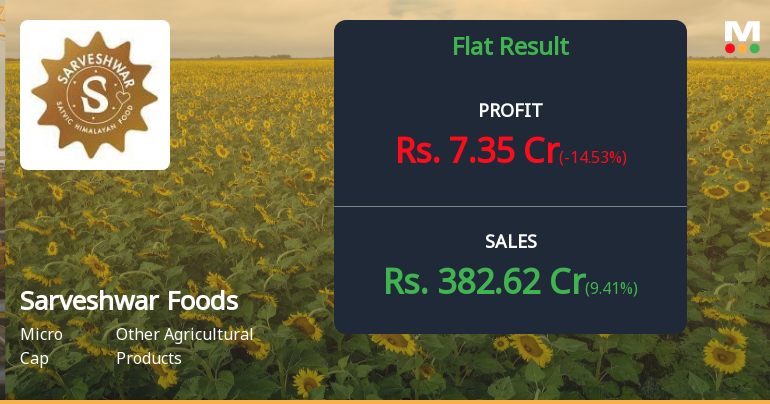
Sarveshwar Foods Q4 FY26: Margin Compression Overshadows Revenue Growth
Sarveshwar Foods Ltd., a micro-cap player in the agricultural products sector, reported a challenging fourth quarter for FY26, with consolidated net profit declining 14.53% year-on-year to ₹7.35 crores despite posting record quarterly revenues. The Jammu-based company, with a market capitalisation of ₹460.00 crores, saw its operating margins compress to multi-quarter lows, raising concerns about profitability sustainability even as topline expansion continued.
Read full news article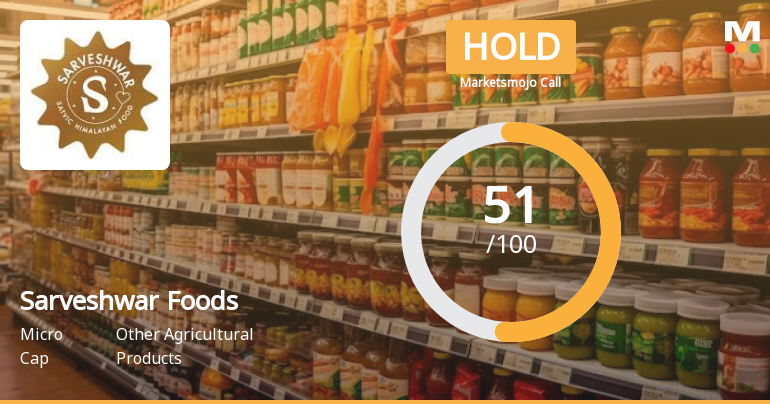
Sarveshwar Foods Ltd is Rated Hold by MarketsMOJO
Sarveshwar Foods Ltd is rated 'Hold' by MarketsMOJO, with this rating last updated on 06 April 2026. However, the analysis and financial metrics discussed here reflect the company’s current position as of 01 June 2026, providing investors with the latest insights into its performance and outlook.
Read full news article Announcements
Announcement under Regulation 30 (LODR)-Newspaper Publication
07-Jun-2026 | Source : BSESarveshwar Foods Limited Informed the exchange regarding newspaper publication of Audited Financial Results for the March 2026.
Announcement under Regulation 30 (LODR)-Press Release / Media Release
06-Jun-2026 | Source : BSEPress Release for the financial results for the Quarter and Year Ended 31st March 2026
Audited Results For The Financials Year Ended 31St March 2026 .
06-Jun-2026 | Source : BSEAudited results for the financial year Ended 31st March 2026.
Corporate Actions

No Upcoming Board Meetings

No Dividend history available

Sarveshwar Foods Ltd has announced 1:10 stock split, ex-date: 15 Sep 23

Sarveshwar Foods Ltd has announced 2:1 bonus issue, ex-date: 15 Sep 23

Sarveshwar Foods Ltd has announced 12:47 rights issue, ex-date: 22 Aug 25
Quality key factors
Valuation key factors
Technicals key factors
 Technical Indicator Scale: Bearish, Mildly Bearish, Sideways, Mildly Bullish, Bullish Turned
 Shareholding Snapshot : Mar 2026
Shareholding Compare (%holding)
Non Institution
None
Held by 0 Schemes
Held by 6 FIIs (0.45%)
Rohit Gupta (40.84%)
Animax Ventures Private Limited (1.26%)
53.51%
Quarterly Results Snapshot (Consolidated) - Mar'26 - YoY

YoY Growth in quarter ended Mar 2026 is 9.41% vs 41.40% in Mar 2025
YoY Growth in quarter ended Mar 2026 is -14.53% vs 107.73% in Mar 2025
Half Yearly Results Snapshot (Consolidated) - Sep'25
Growth in half year ended Sep 2025 is 26.14% vs 28.37% in Sep 2024
Growth in half year ended Sep 2025 is 35.53% vs 45.28% in Sep 2024
Nine Monthly Results Snapshot (Consolidated) - Dec'25
YoY Growth in nine months ended Dec 2025 is 22.44% vs 26.39% in Dec 2024
YoY Growth in nine months ended Dec 2025 is 33.50% vs 44.66% in Dec 2024
Annual Results Snapshot (Consolidated) - Mar'26
YoY Growth in year ended Mar 2026 is 18.43% vs 30.66% in Mar 2025
YoY Growth in year ended Mar 2026 is 18.22% vs 60.44% in Mar 2025
About Sarveshwar Foods Ltd

Company Coordinates


