
Compare Sastasundar Ven. with Similar Stocks
Dashboard
With a Operating Losses, the company has a Weak Long Term Fundamental Strength
Flat results in Dec 25
With ROE of 0, it has a Very Expensive valuation with a 1.3 Price to Book Value
Despite the size of the company, domestic mutual funds hold only 0% of the company
Consistent Underperformance against the benchmark over the last 3 years
Stock DNA
Healthcare Services
INR 859 Cr (Micro Cap)
33.00
22
0.00%
0.00
0.00%
1.26
Total Returns (Price + Dividend) 
Latest dividend: 1 per share ex-dividend date: Jul-23-2012
Risk Adjusted Returns v/s
Returns Beta

News
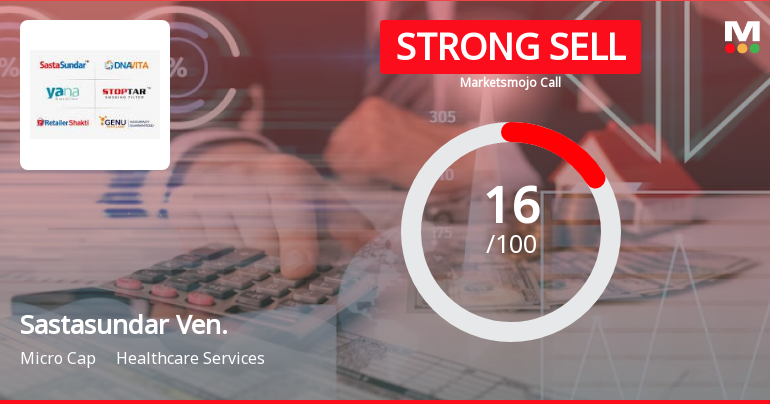
Sastasundar Ventures Ltd is Rated Strong Sell
Sastasundar Ventures Ltd is rated Strong Sell by MarketsMOJO, with this rating last updated on 17 March 2026. However, the analysis and financial metrics presented here reflect the stock's current position as of 19 April 2026, providing investors with the latest insights into the company’s performance and outlook.
Read full news article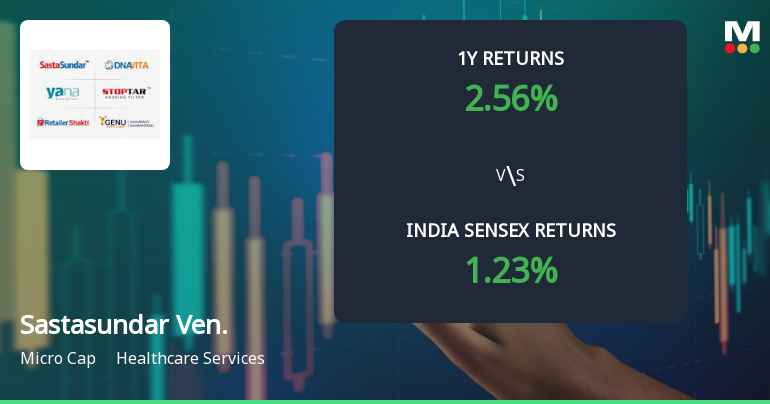
Sastasundar Ventures Ltd Technical Momentum Shifts Amid Bearish Signals
Sastasundar Ventures Ltd, a micro-cap player in the Healthcare Services sector, has experienced a nuanced shift in its technical momentum, reflecting a complex interplay of bearish and mildly bullish signals. Despite a recent downgrade to a Strong Sell rating by MarketsMOJO, the stock’s technical indicators reveal mixed trends that warrant close attention from investors navigating this volatile landscape.
Read full news article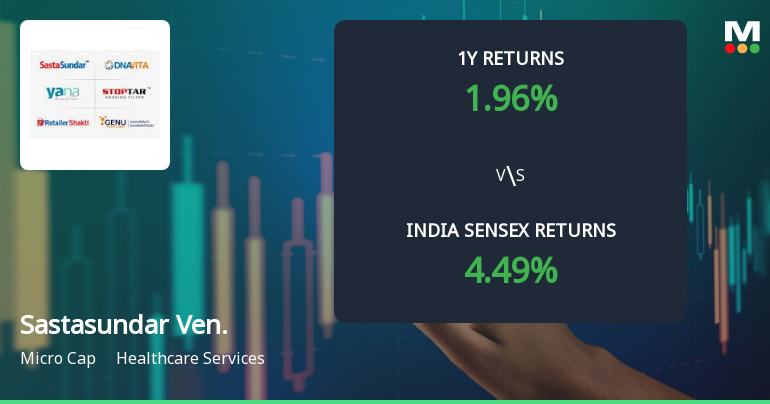
Sastasundar Ventures Ltd Faces Bearish Momentum Amid Technical Downturn
Sastasundar Ventures Ltd, a micro-cap player in the Healthcare Services sector, has experienced a notable shift in its technical momentum, with key indicators signalling a bearish trend. Despite a strong long-term return profile, recent technical parameters have deteriorated, prompting a downgrade in its MarketsMOJO Mojo Grade to Strong Sell as of 17 Mar 2026.
Read full news article Announcements
Compliances-Certificate under Reg. 74 (5) of SEBI (DP) Regulations 2018
06-Apr-2026 | Source : BSECertificate under Regulation 74(5) of the SEBI (Depositories and Participants) Reg 2018 for the quarter ended March 31 2026.
Disclosure Under Regulation 7(2) Of The SEBI (Prohibition Of Insider Trading) Reg 2015
01-Apr-2026 | Source : BSEPlease find attached the disclosure.
Disclosures under Reg. 29(2) of SEBI (SAST) Regulations 2011
28-Mar-2026 | Source : BSEThe Exchange has received the disclosure under Regulation 29(2) of SEBI (Substantial Acquisition of Shares & Takeovers) Regulations 2011 for Banwari Lal Mittal and Luv Kush Projects Ltd & PACs
Corporate Actions

No Upcoming Board Meetings

Sastasundar Ventures Ltd has declared 10% dividend, ex-date: 23 Jul 12

No Splits history available

No Bonus history available

No Rights history available
Quality key factors
Valuation key factors
Technicals key factors
 Technical Indicator Scale: Bearish, Mildly Bearish, Sideways, Mildly Bullish, Bullish Turned
 Shareholding Snapshot : Dec 2025
Shareholding Compare (%holding)
Promoters
None
Held by 2 Schemes (0.0%)
Held by 5 FIIs (2.25%)
Banwari Lal Mittal (33.76%)
Lekh Raj Juneja (1.89%)
12.72%
Quarterly Results Snapshot (Consolidated) - Dec'25 - YoY

YoY Growth in quarter ended Dec 2025 is 22.91% vs -24.89% in Dec 2024
YoY Growth in quarter ended Dec 2025 is 104.19% vs -3,492.00% in Dec 2024
Annual Results Snapshot (Consolidated) - Mar'25

YoY Growth in year ended Mar 2025 is -19.66% vs 30.60% in Mar 2024
YoY Growth in year ended Mar 2025 is -2,382.74% vs 105.88% in Mar 2024
About Sastasundar Ventures Ltd

Company Coordinates


