
Compare Satin Creditcare with Similar Stocks
Dashboard
Weak Long Term Fundamental Strength with an average Return on Equity (ROE) of 7.74%
With a growth in Net Profit of 125.35%, the company declared Very Positive results in Mar 26
With ROE of 11.6, it has a Attractive valuation with a 1 Price to Book Value
Majority shareholders : Non Institution
Market Beating performance in long term as well as near term
Total Returns (Price + Dividend) 
Satin Creditcare for the last several years.
Risk Adjusted Returns v/s
Returns Beta

News
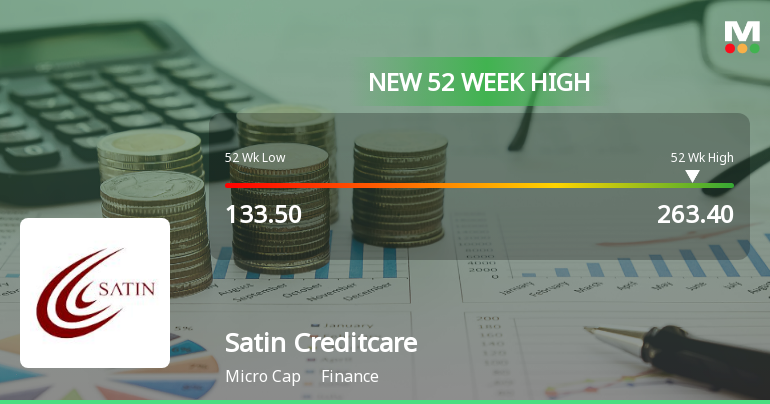
Broad-Based Technical Strength Lifts Satin Creditcare Network Ltd to 52-Week High of Rs 263.4
From a 52-week low of Rs 133.5 to a fresh high of Rs 263.4, Satin Creditcare Network Ltd has surged over 55% in the past year, significantly outperforming the Sensex which declined by 6.34% over the same period. This milestone was reached on 3 Jul 2026, marking a notable moment in the stock’s momentum-driven rally.
Read full news article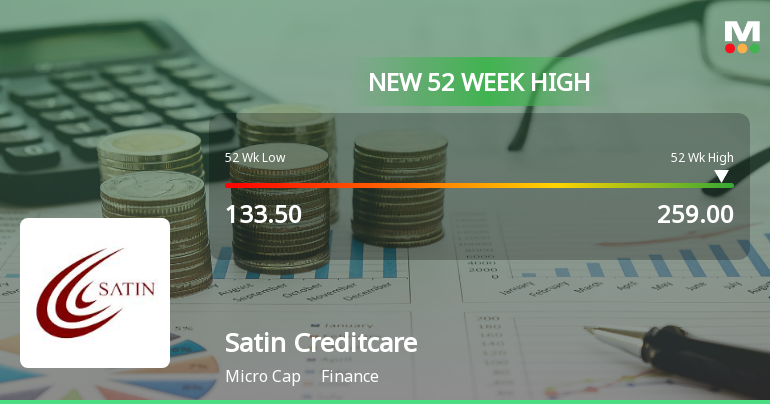
Broad-Based Technical Strength Lifts Satin Creditcare Network Ltd to 52-Week High of Rs 259
With a decisive break above Rs 259 on 2 Jul 2026, Satin Creditcare Network Ltd has reached a fresh 52-week high, extending its impressive rally that has delivered over 54% returns in the past year. This milestone comes amid a sustained alignment of key technical indicators signalling robust momentum across multiple timeframes.
Read full news article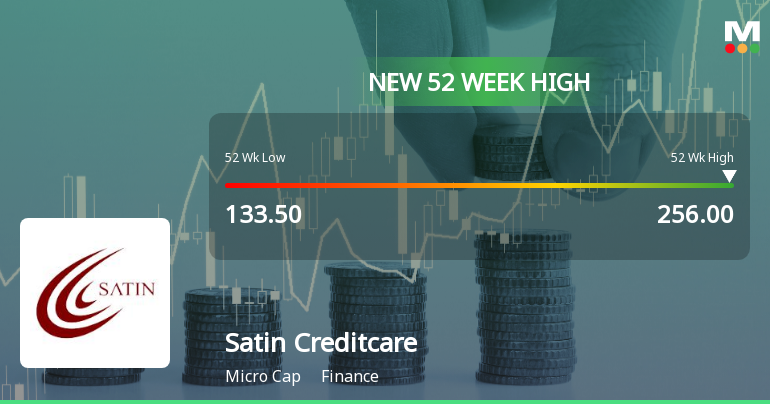
Broad-Based Technical Strength Lifts Satin Creditcare Network Ltd to 52-Week High of Rs 254
With a decisive break above Rs 254 on 1 Jul 2026, Satin Creditcare Network Ltd has reached a fresh 52-week high, marking a 49.7% gain over the past year and significantly outperforming the Sensex, which declined 8.33% in the same period.
Read full news article Announcements
Announcement under Regulation 30 (LODR)-Credit Rating
01-Jul-2026 | Source : BSEAnnouncement under Regulation 30 of SEBI (LODR) Regulations 2015 - Credit Rating
Closure of Trading Window
24-Jun-2026 | Source : BSEIntimation of Closure of Trading Window
Board Meeting Outcome for Outcome Of Board Meeting
23-Jun-2026 | Source : BSEDisclosure under Regulations 30 and 51 of SEBI (LODR) Regulations 2015
Corporate Actions

No Upcoming Board Meetings

No Dividend history available

No Splits history available

No Bonus history available

No Rights history available
Quality key factors
Valuation key factors
Technicals key factors
 Technical Indicator Scale: Bearish, Mildly Bearish, Sideways, Mildly Bullish, Bullish Turned
 Shareholding Snapshot : Mar 2026
Shareholding Compare (%holding)
Non Institution
None
Held by 1 Schemes (1.4%)
Held by 37 FIIs (3.51%)
Trishashna Holdings & Investments Private Limited (34.32%)
Florintree Ventures Llp (11.14%)
19.7%
Quarterly Results Snapshot (Consolidated) - Mar'26 - QoQ

QoQ Growth in quarter ended Mar 2026 is 24.29% vs -6.10% in Dec 2025
QoQ Growth in quarter ended Mar 2026 is 125.31% vs 35.27% in Dec 2025
Half Yearly Results Snapshot (Consolidated) - Sep'25

Growth in half year ended Sep 2025 is 16.05% vs 29.59% in Sep 2024
Growth in half year ended Sep 2025 is -34.48% vs -22.95% in Sep 2024
Nine Monthly Results Snapshot (Consolidated) - Dec'25
YoY Growth in nine months ended Dec 2025 is 13.31% vs 24.08% in Dec 2024
YoY Growth in nine months ended Dec 2025 is 3.62% vs -46.63% in Dec 2024
Annual Results Snapshot (Consolidated) - Mar'26
YoY Growth in year ended Mar 2026 is 22.23% vs 15.16% in Mar 2025
YoY Growth in year ended Mar 2026 is 78.47% vs -57.30% in Mar 2025
About Satin Creditcare Network Ltd

Company Coordinates


