
Compare Saurashtra Cem. with Similar Stocks
Dashboard
Weak Long Term Fundamental Strength with a -38.57% CAGR growth in Operating Profits over the last 5 years
- Company's ability to service its debt is weak with a poor EBIT to Interest (avg) ratio of 1.54
- The company has been able to generate a Return on Equity (avg) of 2.13% signifying low profitability per unit of shareholders funds
Despite the size of the company, domestic mutual funds hold only 0% of the company
Below par performance in long term as well as near term
Stock DNA
Cement & Cement Products
INR 651 Cr (Micro Cap)
27.00
32
0.00%
-0.12
2.55%
0.66
Total Returns (Price + Dividend) 
Latest dividend: 1 per share ex-dividend date: Aug-14-2024
Risk Adjusted Returns v/s
Returns Beta

News
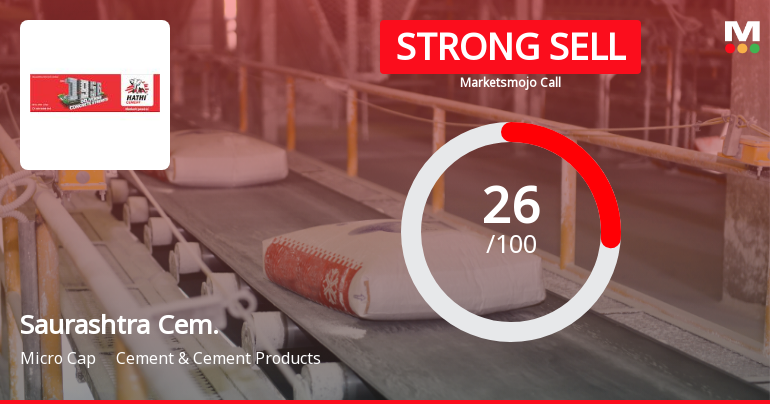
Saurashtra Cement Ltd Downgraded to Strong Sell Amid Weak Fundamentals and Bearish Technicals
Saurashtra Cement Ltd has seen its investment rating downgraded from Sell to Strong Sell as of 3 June 2026, reflecting deteriorating technical indicators, weak financial trends, and a cautious valuation stance. Despite some positive quarterly earnings growth, the company’s long-term fundamentals and technical outlook have worsened, prompting a reassessment of its investment appeal within the Cement & Cement Products sector.
Read full news article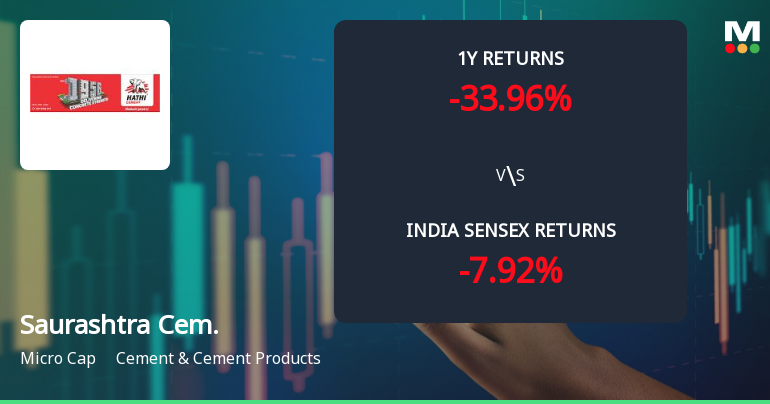
Saurashtra Cement Ltd Faces Bearish Momentum Amid Technical Downgrade
Saurashtra Cement Ltd, a micro-cap player in the Cement & Cement Products sector, has experienced a notable shift in its technical momentum, moving from a mildly bearish to a bearish trend. Despite a marginal day gain of 0.25%, the stock’s technical indicators reveal a complex picture with mixed signals across weekly and monthly timeframes, underscoring challenges ahead for investors amid a deteriorating fundamental outlook.
Read full news article
Saurashtra Cement Ltd Technical Momentum Shifts Amid Prolonged Downtrend
Saurashtra Cement Ltd, a micro-cap player in the Cement & Cement Products sector, has experienced a subtle shift in its technical momentum, moving from a strongly bearish stance to a mildly bearish trend. Despite this slight improvement, the stock continues to face significant headwinds, reflected in its recent price action and technical indicators, which suggest cautious investor sentiment amid a challenging market environment.
Read full news article Announcements
Announcement under Regulation 30 (LODR)-Newspaper Publication
09-Jun-2026 | Source : BSEPlease find enclosed copies of the newspaper advertisements published today 9th June 2026 in the Newspapers viz Business Standard (All India Standard - English) and Jay Hind (Rajkot Edition - Gujarati) inter alia informing about the Investor Education and Protection Fund Authoritys (IEPFA) 100 days campaign Saksham Niveshak and Special Window for Transfer and Dematerialization of Physical Shares.
Announcement under Regulation 30 (LODR)-Change in Management
18-May-2026 | Source : BSEIn compliance with provisions of Regulation 30 of SEBI (LODR) Regulations 2015 read with Part A of Schedule III of the said Regulations we would like to inform you about the resignation of Mr. Surender Bhatia Chief Executive Officer CEO - Paints Division of the Company due to personal reasons.
Compliances-Reg.24(A)-Annual Secretarial Compliance
15-May-2026 | Source : BSEPlease find enclosed herewith Annual Secretarial Compliance Report for the year ended 31st March 2-26 issued by Secretarial Auditor for the year ended 31st March 2026
Corporate Actions

No Upcoming Board Meetings

Saurashtra Cement Ltd has declared 10% dividend, ex-date: 14 Aug 24

No Splits history available

No Bonus history available

No Rights history available
Quality key factors
Valuation key factors
Technicals key factors
 Technical Indicator Scale: Bearish, Mildly Bearish, Sideways, Mildly Bullish, Bullish Turned
 Shareholding Snapshot : Mar 2026
Shareholding Compare (%holding)
Promoters
None
Held by 1 Schemes (0.0%)
Held by 6 FIIs (0.16%)
Mehta Investments Mauritius Limited (18.63%)
Toro Managers Limited (2.21%)
23.34%
Quarterly Results Snapshot (Consolidated) - Mar'26 - QoQ

QoQ Growth in quarter ended Mar 2026 is 8.89% vs 6.37% in Dec 2025
QoQ Growth in quarter ended Mar 2026 is 282.99% vs 6.28% in Dec 2025
Half Yearly Results Snapshot (Consolidated) - Sep'25
Growth in half year ended Sep 2025 is 18.64% vs -16.92% in Sep 2024
Growth in half year ended Sep 2025 is 127.21% vs -266.56% in Sep 2024
Nine Monthly Results Snapshot (Consolidated) - Dec'25
YoY Growth in nine months ended Dec 2025 is 15.08% vs -16.42% in Dec 2024
YoY Growth in nine months ended Dec 2025 is 82.95% vs -201.61% in Dec 2024
Annual Results Snapshot (Consolidated) - Mar'26
YoY Growth in year ended Mar 2026 is 8.35% vs -12.89% in Mar 2025
YoY Growth in year ended Mar 2026 is 106.59% vs -87.67% in Mar 2025
About Saurashtra Cement Ltd

Company Coordinates


