
Compare Sayaji Hotels with Similar Stocks
Dashboard
Poor Management Efficiency with a low ROCE of 9.67%
- The company has been able to generate a Return on Capital Employed (avg) of 9.67% signifying low profitability per unit of total capital (equity and debt)
Poor long term growth as Net Sales has grown by an annual rate of 12.63% over the last 5 years
Flat results in Mar 26
With ROCE of 4.8, it has a Fair valuation with a 2.4 Enterprise value to Capital Employed
Despite the size of the company, domestic mutual funds hold only 0.07% of the company
Stock DNA
Hotels & Resorts
INR 517 Cr (Micro Cap)
NA (Loss Making)
34
0.00%
0.76
-8.50%
3.32
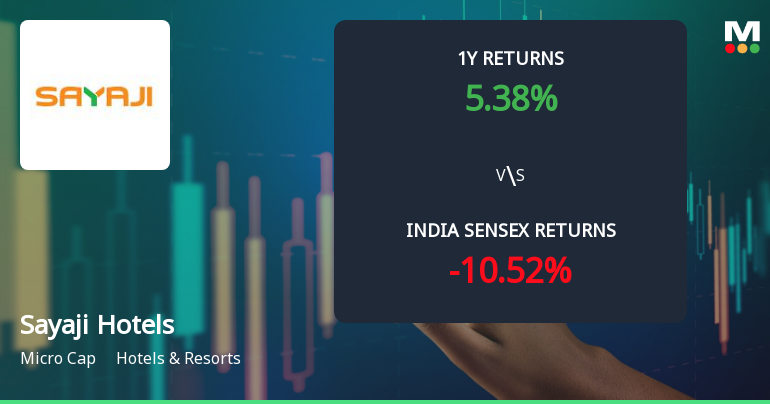
Total Returns (Price + Dividend) 
Sayaji Hotels for the last several years.
Risk Adjusted Returns v/s
Returns Beta

News
Sayaji Hotels Ltd Technical Momentum Shifts Signal Mildly Bullish Outlook
Sayaji Hotels Ltd has demonstrated a notable shift in its technical momentum, moving from a sideways trend to a mildly bullish stance. This change is underscored by improvements in key technical indicators such as the MACD, Bollinger Bands, and KST, signalling a potential positive trajectory for the micro-cap hotel and resorts company amid a recovering market environment.
Read full news article
Sayaji Hotels Ltd Upgraded to Hold on Technical Improvements and Valuation Appeal
Sayaji Hotels Ltd has seen its investment rating upgraded from Sell to Hold as of 9 June 2026, reflecting a shift in technical indicators and valuation metrics despite flat financial performance. The company’s technical trend has improved to mildly bullish, while valuation remains fair relative to peers. However, challenges persist in financial trends and management efficiency, warranting a cautious stance for investors.
Read full news article
Sayaji Hotels Ltd Technical Momentum Shifts to Mildly Bullish Amid Market Recovery
Sayaji Hotels Ltd has witnessed a notable shift in its technical momentum, moving from a mildly bearish stance to a mildly bullish outlook. This change is underscored by improvements in key technical indicators such as the MACD, Bollinger Bands, and KST, signalling a potential uptrend in the Hotels & Resorts sector despite mixed longer-term returns compared to the broader Sensex.
Read full news article Announcements
Intimation Under Regulation 30 Of The SEBI (Listing Obligations And Disclosure Requirements) Regulations 2015 - Termination Of Agreement With Wonder Leopard Retreat Private Limited
01-Jun-2026 | Source : BSETermination of Hotel Management Agreement Executed Between Sayaji Hotels Limited and Wonder Leopard Retreat Private Limited.
Intimation Under Regulation 30 Of The Securities And Exchange Board Of India (Listing Obligations And Disclosure Requirements) Regulations 2015 Of Entering Into Hotel Management Agreement .
01-Jun-2026 | Source : BSESayaji Hotels Limited has entered into Hotel Management Agreement for providing operational and management services for hotel property located at Tadoba Chandrapur Maharashtra.
Intimation Under Regulation 30 Of SEBI (Listing Obligations And Disclosure Requirements) Regulation 2015 [Listing Regulations]
29-May-2026 | Source : BSEIntimation for approval of investment of 26% of Equity Shares in the proposed Company Avanir Wellness Resorts Private Limited by the Board of Directors at their meeting held on 28-05-2026 pursuant to the Award issued by Nava Raipur Atal Nagar Vikas Pradhikaran (NRANVP) dated March 20 2026.
Corporate Actions

No Upcoming Board Meetings

No Dividend history available

No Splits history available

No Bonus history available

No Rights history available
Quality key factors
Valuation key factors
Technicals key factors
 Technical Indicator Scale: Bearish, Mildly Bearish, Sideways, Mildly Bullish, Bullish Turned
 Shareholding Snapshot : Mar 2026
Shareholding Compare (%holding)
Promoters
2.5628
Held by 1 Schemes (0.02%)
Held by 0 FIIs
Suchitra Dhanani (20.95%)
Kayum Razak Dhanani (9.11%)
14.81%
Quarterly Results Snapshot (Consolidated) - Mar'26 - YoY

YoY Growth in quarter ended Mar 2026 is -5.04% vs 17.45% in Mar 2025

YoY Growth in quarter ended Mar 2026 is 241.59% vs -153.43% in Mar 2025
Half Yearly Results Snapshot (Consolidated) - Sep'25
Growth in half year ended Sep 2025 is 19.83% vs 20.63% in Sep 2024
Growth in half year ended Sep 2025 is -49,833.33% vs 98.48% in Sep 2024
Nine Monthly Results Snapshot (Consolidated) - Dec'25
YoY Growth in nine months ended Dec 2025 is 12.70% vs 26.42% in Dec 2024
YoY Growth in nine months ended Dec 2025 is -294.80% vs 0.47% in Dec 2024
Annual Results Snapshot (Consolidated) - Mar'26
YoY Growth in year ended Mar 2026 is 7.59% vs 23.73% in Mar 2025
YoY Growth in year ended Mar 2026 is -403.85% vs -85.50% in Mar 2025
About Sayaji Hotels Ltd

Company Coordinates


