
Compare Sayaji (Indore) with Similar Stocks
Dashboard
Weak Long Term Fundamental Strength with an average Return on Equity (ROE) of 14.65%
- Poor long term growth as Net Sales has grown by an annual rate of 5.83% and Operating profit at 6.30%
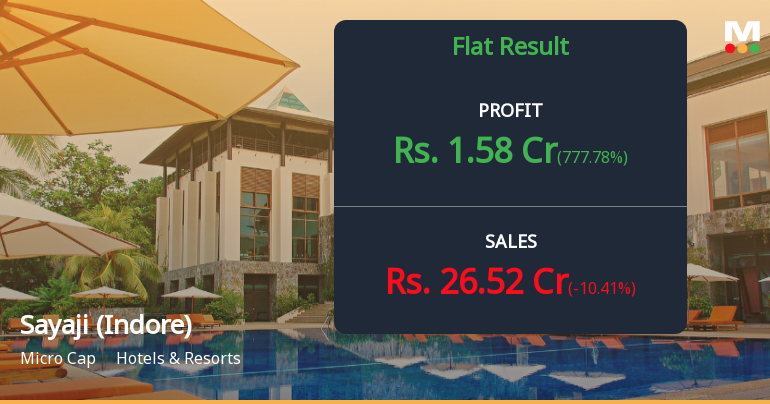
Flat results in Jun 26
With ROE of 12.9, it has a Very Expensive valuation with a 5.5 Price to Book Value
Reducing Promoter Confidence
Stock DNA
Hotels & Resorts
INR 385 Cr (Micro Cap)
42.00
38
0.06%
1.88
12.91%
5.49
Total Returns (Price + Dividend) 
Latest dividend: 0.8 per share ex-dividend date: Nov-20-2025
Risk Adjusted Returns v/s
Returns Beta

News
Sayaji Hotels Q1 FY27: Modest Growth Masks Margin Pressures and Valuation Concerns
Sayaji Hotels (Indore) Ltd., a micro-cap player in India's hospitality sector, reported a mixed first quarter for FY2027, with net profit rising 11.62% year-on-year to ₹1.58 crores but declining sequentially by 10.41% from the previous quarter. The company, with a market capitalisation of ₹402.15 crores, trades at ₹1,320.00 per share, down 0.75% following the results announcement. Whilst revenue growth remained positive on an annual basis, deteriorating operating margins and elevated valuations raise serious questions about the sustainability of the current stock price.
Read full news article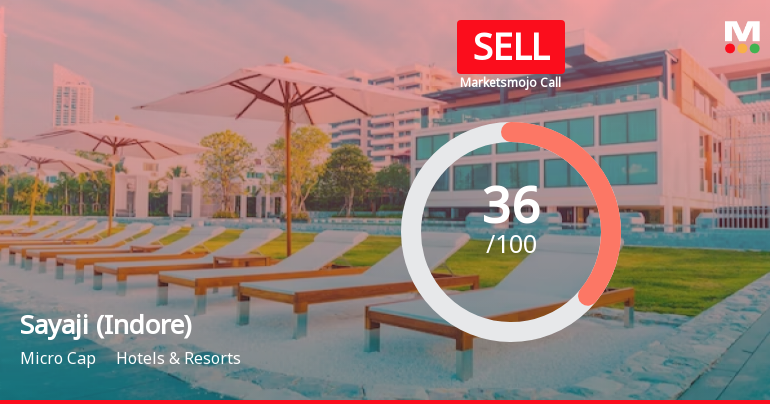
Sayaji Hotels (Indore) Ltd is Rated Sell
Sayaji Hotels (Indore) Ltd is rated Sell by MarketsMOJO, with this rating last updated on 21 May 2026. However, the analysis and financial metrics discussed here reflect the company’s current position as of 27 July 2026, providing investors with the latest insights into its performance and outlook.
Read full news article Announcements
Announcement under Regulation 30 (LODR)-Newspaper Publication
31-Jul-2026 | Source : BSEIntimation pertains to the Newspaper publication of Post Dispatch of Notice of the 8th Annual General Meeting of the Company.
Reg. 34 (1) Annual Report.
30-Jul-2026 | Source : BSEAnnual Report of the Company for the Financial Year 2025-26
Announcement under Regulation 30 (LODR)-Resignation of Company Secretary / Compliance Officer
30-Jul-2026 | Source : BSEIntimation of Resignation tendered by the Company Secretary and Compliance Officer of the Company effective from 29th August 2026.
Corporate Actions

No Upcoming Board Meetings

Sayaji Hotels (Indore) Ltd has declared 8% dividend, ex-date: 20 Nov 25

No Splits history available

No Bonus history available

No Rights history available
Quality key factors
Valuation key factors
Technicals key factors
 Technical Indicator Scale: Bearish, Mildly Bearish, Sideways, Mildly Bullish, Bullish Turned
 Shareholding Snapshot : Jun 2026
Shareholding Compare (%holding)
Promoters
None
Held by 0 Schemes
Held by 0 FIIs
Century 21 Officespace Private Limited (30.34%)
Deepder Real Estate Llp (7.68%)
5.52%
Quarterly Results Snapshot (Standalone) - Jun'26 - QoQ

QoQ Growth in quarter ended Jun 2026 is -10.41% vs -7.87% in Mar 2026

QoQ Growth in quarter ended Jun 2026 is 777.78% vs -96.93% in Mar 2026
Half Yearly Results Snapshot (Standalone) - Sep'25
Growth in half year ended Sep 2025 is -2.48% vs 7.28% in Sep 2024
Growth in half year ended Sep 2025 is 21.74% vs 162.89% in Sep 2024
Nine Monthly Results Snapshot (Standalone) - Dec'25
YoY Growth in nine months ended Dec 2025 is 1.08% vs 10.57% in Dec 2024
YoY Growth in nine months ended Dec 2025 is 27.32% vs 163.95% in Dec 2024
Annual Results Snapshot (Standalone) - Mar'26
YoY Growth in year ended Mar 2026 is 0.82% vs 9.89% in Mar 2025
YoY Growth in year ended Mar 2026 is -24.22% vs 47.21% in Mar 2025
About Sayaji Hotels (Indore) Ltd

Company Coordinates


