
Compare SBC Exports with Similar Stocks
Dashboard
Healthy long term growth as Operating profit has grown by an annual rate 58.68%
The company has declared Positive results for the last 3 consecutive quarters
With ROCE of 10.9, it has a Very Expensive valuation with a 6.9 Enterprise value to Capital Employed
32.93% of Promoter Shares are Pledged
Market Beating performance in long term as well as near term
Stock DNA
Garments & Apparels
INR 1,773 Cr (Micro Cap)
52.00
23
0.00%
2.61
42.72%
21.93
Total Returns (Price + Dividend) 
Latest dividend: 0.05 per share ex-dividend date: Sep-23-2024
Risk Adjusted Returns v/s
Returns Beta

News

SBC Exports Ltd is Rated Hold by MarketsMOJO
SBC Exports Ltd is rated 'Hold' by MarketsMOJO, with this rating last updated on 08 Nov 2025. However, the analysis and financial metrics discussed here reflect the company’s current position as of 08 June 2026, providing investors with an up-to-date perspective on the stock’s fundamentals, valuation, financial trends, and technical outlook.
Read full news article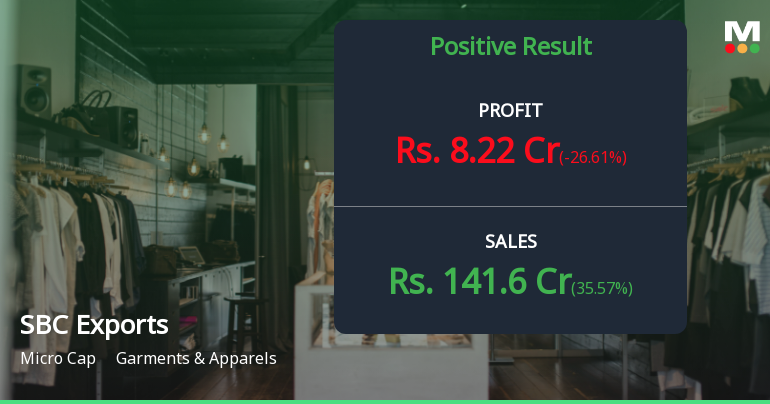
SBC Exports Q4 FY26: Explosive Revenue Growth Masks Margin Concerns as Other Income Dominates Profitability
SBC Exports Ltd., a micro-cap garments and apparels manufacturer with a market capitalisation of ₹1,885.00 crores, reported a paradoxical Q4 FY26 performance that showcased explosive topline expansion alongside troubling profitability dynamics. Net profit for the quarter ended March 2026 stood at ₹8.22 crores, declining 26.61% quarter-on-quarter but surging 104.99% year-on-year, whilst revenue rocketed 47.04% YoY to ₹141.60 crores—the highest quarterly sales in the company's history.
Read full news article Announcements
Intimation Regarding Hold On Preferential Issue Approved By The Board On 29Th May 2026 Due To Procedural Complexities
05-Jun-2026 | Source : BSEUpdate on Preferential Allotment approved by Board on 29th May 2026.
Announcement under Regulation 30 (LODR)-Award_of_Order_Receipt_of_Order
02-Jun-2026 | Source : BSEExport Order received from Dubai Based company _Huxx readymade Garments trading LLC amounting 18 cr.
Announcement Under Regulation 30 Of SEBI(LODR) Regulation _Launching F Route Website
02-Jun-2026 | Source : BSELaunching F route clothing Brand F route
Corporate Actions

No Upcoming Board Meetings

SBC Exports Ltd has declared 5% dividend, ex-date: 23 Sep 24

SBC Exports Ltd has announced 1:10 stock split, ex-date: 22 Feb 22

SBC Exports Ltd has announced 1:2 bonus issue, ex-date: 10 Mar 25

No Rights history available
Quality key factors
Valuation key factors
Technicals key factors
 Technical Indicator Scale: Bearish, Mildly Bearish, Sideways, Mildly Bullish, Bullish Turned
 Shareholding Snapshot : Mar 2026
Shareholding Compare (%holding)
Promoters
32.9269
Held by 0 Schemes
Held by 3 FIIs (0.77%)
Deepika Gupta (23.3%)
M/s Eastend Infrastructure Private Limited (1.58%)
35.64%
Quarterly Results Snapshot (Consolidated) - Mar'26 - QoQ

QoQ Growth in quarter ended Mar 2026 is 35.57% vs 23.32% in Dec 2025

QoQ Growth in quarter ended Mar 2026 is -26.61% vs -1.50% in Dec 2025
Half Yearly Results Snapshot (Consolidated) - Sep'25
Growth in half year ended Sep 2025 is 19.32% vs 49.53% in Sep 2024
Growth in half year ended Sep 2025 is 38.86% vs 57.99% in Sep 2024
Nine Monthly Results Snapshot (Consolidated) - Dec'25
YoY Growth in nine months ended Dec 2025 is 28.39% vs 45.49% in Dec 2024
YoY Growth in nine months ended Dec 2025 is 81.52% vs 48.91% in Dec 2024
Annual Results Snapshot (Consolidated) - Mar'26
YoY Growth in year ended Mar 2026 is 34.38% vs 43.28% in Mar 2025
YoY Growth in year ended Mar 2026 is 89.01% vs 41.48% in Mar 2025
About SBC Exports Ltd

Company Coordinates


