
Compare Secmark Consult. with Similar Stocks
Dashboard
Company has a Debt to Equity ratio (avg) of 0.01 times
Healthy long term growth as Operating profit has grown by an annual rate 68.78%
With ROE of 11, it has a Expensive valuation with a 5.6 Price to Book Value
Majority shareholders : Promoters
Underperformed the market in the last 1 year
Stock DNA
Computers - Software & Consulting
INR 138 Cr (Micro Cap)
51.00
20
0.00%
-0.63
10.98%
5.58
Total Returns (Price + Dividend) 
Secmark Consult. for the last several years.
Risk Adjusted Returns v/s
Returns Beta

News
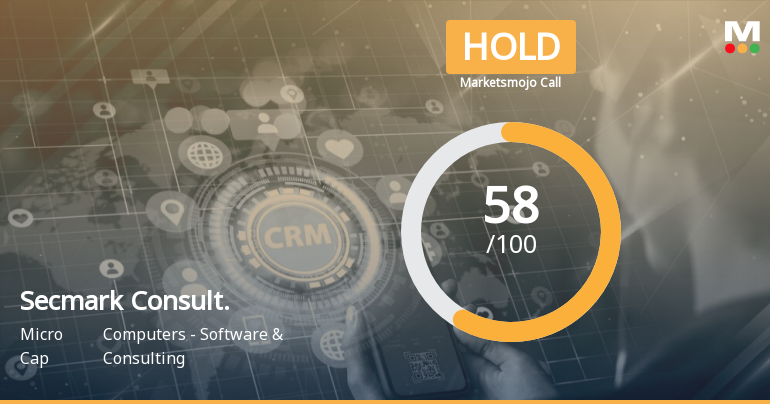
Secmark Consultancy Ltd is Rated Hold
Secmark Consultancy Ltd is rated 'Hold' by MarketsMOJO, with this rating last updated on 26 May 2026. However, the analysis and financial metrics presented here reflect the stock's current position as of 07 July 2026, providing investors with an up-to-date view of the company’s fundamentals, returns, and market standing.
Read full news article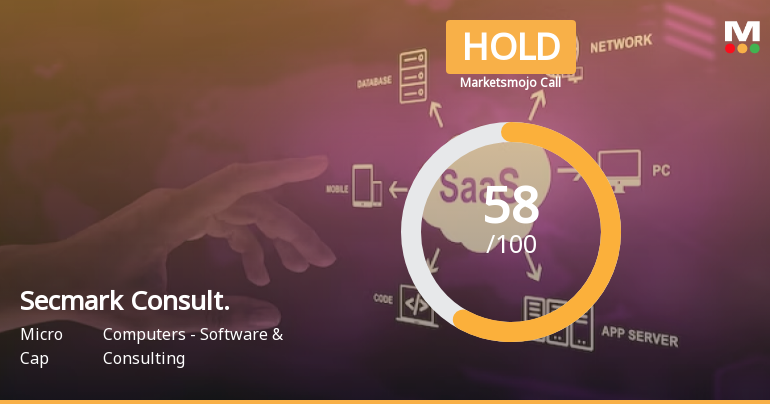
Secmark Consultancy Ltd is Rated Hold
Secmark Consultancy Ltd is rated 'Hold' by MarketsMOJO, with this rating last updated on 26 May 2026. However, the analysis and financial metrics discussed here reflect the stock's current position as of 26 June 2026, providing investors with the most recent and relevant data to assess the company’s outlook.
Read full news article
Secmark Consultancy Ltd is Rated Hold
Secmark Consultancy Ltd is rated 'Hold' by MarketsMOJO, with this rating last updated on 26 May 2026. However, the analysis and financial metrics presented here reflect the company’s current position as of 15 June 2026, providing investors with the latest insights into its performance and outlook.
Read full news article Announcements
Compliances-Certificate under Reg. 74 (5) of SEBI (DP) Regulations 2018
10-Jul-2026 | Source : BSECompliance under Regulation 74(5) of SEBI (Depositories and Participants) Regulations 2018 for the quarter ended June 30 2026.
Announcement under Regulation 30 (LODR)-Acquisition
03-Jul-2026 | Source : BSEPursuant to Regulation 30 of SEBI (LODR) Regulations 2015 we wish to inform you that the Board of Directors of the Company on July 03 2026 has inter alia approved the incorporation of the proposed Wholly Owned Subsidiary of the Company.
Closure of Trading Window
25-Jun-2026 | Source : BSEIntimation of closure of trading window from July 01 2026 till the conclusion of 48 hours after declaration of the Unaudited Financial Results (Standalone and Consolidated) of the Company for the Quarter ending June 30 2026.
Corporate Actions

No Upcoming Board Meetings

No Dividend history available

No Splits history available

Secmark Consultancy Ltd has announced 3:2 bonus issue, ex-date: 12 Oct 22

No Rights history available
Quality key factors
Valuation key factors
Technicals key factors
 Technical Indicator Scale: Bearish, Mildly Bearish, Sideways, Mildly Bullish, Bullish Turned
 Shareholding Snapshot : Mar 2026
Shareholding Compare (%holding)
Promoters
None
Held by 0 Schemes
Held by 0 FIIs
Secmark Holdings Private Limited (72.03%)
Codifi Finserv Private Limited (3.57%)
18.11%
Quarterly Results Snapshot (Consolidated) - Mar'26 - QoQ

QoQ Growth in quarter ended Mar 2026 is 97.24% vs -22.29% in Dec 2025
QoQ Growth in quarter ended Mar 2026 is 338.83% vs -318.60% in Dec 2025
Half Yearly Results Snapshot (Consolidated) - Sep'25

Growth in half year ended Sep 2025 is 9.37% vs 35.00% in Sep 2024
Growth in half year ended Sep 2025 is -110.81% vs 108.47% in Sep 2024
Nine Monthly Results Snapshot (Consolidated) - Dec'25
YoY Growth in nine months ended Dec 2025 is 2.74% vs 30.75% in Dec 2024
YoY Growth in nine months ended Dec 2025 is -633.33% vs 108.28% in Dec 2024
Annual Results Snapshot (Consolidated) - Mar'26
YoY Growth in year ended Mar 2026 is 6.92% vs 42.78% in Mar 2025
YoY Growth in year ended Mar 2026 is -40.09% vs 276.54% in Mar 2025
About Secmark Consultancy Ltd

Company Coordinates


