
Compare Segue Group Co., Ltd. with Similar Stocks
Dashboard
Strong Long Term Fundamental Strength with an average Return on Equity (ROE) of 17.68%
- Healthy long term growth as Net Sales has grown by an annual rate of 14.43% and Operating profit at 0.65%
- Company has very low debt and has enough cash to service the debt requirements
With ROE of 9.08%, it has a very attractive valuation with a 4.90 Price to Book Value
Stock DNA
Computers - Software & Consulting
JPY 20,385 Million (Small Cap)
54.00
NA
0.00%
-0.24
27.13%
5.14
Total Returns (Price + Dividend) 
Segue Group Co., Ltd. for the last several years.
Risk Adjusted Returns v/s
News
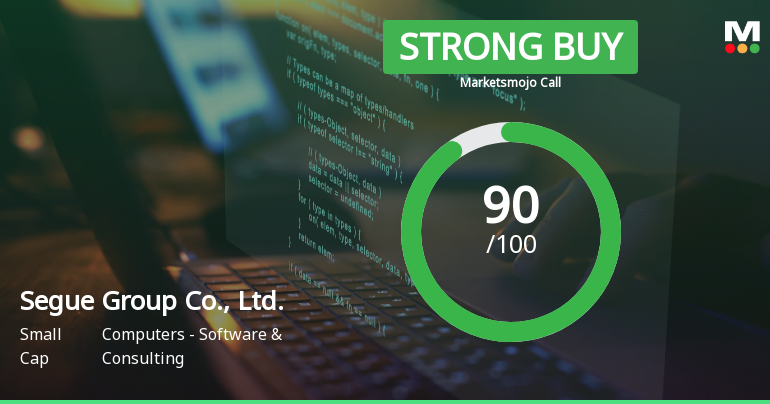
Segue Group Co. Transitions to Strong Buy Amid Mixed Technical Indicators and Solid Fundamentals
Segue Group Co., Ltd. has recently experienced a significant evaluation adjustment, moving from 'Not Rated' to 'Strong Buy.' The company's technical indicators show a mix of bullish and bearish signals, while its long-term fundamentals highlight a strong Return on Equity and low debt, despite a recent profit decline.
Read full news articleSegue Group Co., Ltd. Reports Strong Financial Performance in Latest Quarter
Segue Group Co., Ltd., a small-cap company operating in the Computers - Software & Consulting sector, has reported positive financial results for the quarter ending June 2025. The company has demonstrated significant growth across various financial metrics, showcasing its robust performance in a competitive market.
One of the highlights of the financial results is the notable increase in net sales, which reached JPY 5,212.65 MM, reflecting a growth rate of 12.39% compared to the previous year. This growth in sales is indicative of the company's ability to capture market demand and expand its customer base.
In addition to sales growth, Segue Group Co., Ltd. achieved its highest operating profit for the quarter at JPY 565.13 MM, resulting in an impressive operating profit margin of 10.84%. This margin underscores the company's efficiency in managing its ope...
Read full news article
Segue Group Soars 11.98%, Hits Intraday High of JPY 743.00
Segue Group Co., Ltd. has seen a notable increase in its stock price, reaching an intraday high amid a broader market decline. The company has demonstrated strong growth in net sales and maintains a healthy financial position, despite recent profit declines, indicating a solid foundation for future performance.
Read full news article Announcements

Corporate Actions
Quality key factors
Valuation key factors
Technicals key factors
 Technical Indicator Scale: Bearish, Mildly Bearish, Sideways, Mildly Bullish, Bullish Turned
 Shareholding Snapshot
Shareholding Compare (%holding)
Quarterly Results Snapshot (Consolidated) - Sep'25 - QoQ

QoQ Growth in quarter ended Sep 2025 is 50.75% vs 8.86% in Jun 2025

QoQ Growth in quarter ended Sep 2025 is 102.91% vs 107.14% in Jun 2025
Annual Results Snapshot (Consolidated) - Dec'24
YoY Growth in year ended Dec 2024 is 7.31% vs 28.04% in Dec 2023
YoY Growth in year ended Dec 2024 is -17.49% vs -12.67% in Dec 2023
About Segue Group Co., Ltd.

Company Coordinates


