
Compare Senores Pharma. with Similar Stocks
Dashboard
Company has a Debt to Equity ratio (avg) of 0.10 times
Healthy long term growth as Net Sales has grown by an annual rate of 71.70% and Operating profit at 108.34%
The company has declared Positive results for the last 4 consecutive quarters
Increasing Participation by Institutional Investors
Market Beating Performance
Stock DNA
Pharmaceuticals & Biotechnology
INR 5,806 Cr (Small Cap)
50.00
34
0.00%
0.20
12.36%
6.36
Total Returns (Price + Dividend) 
Senores Pharma. for the last several years.
Risk Adjusted Returns v/s
Returns Beta

News
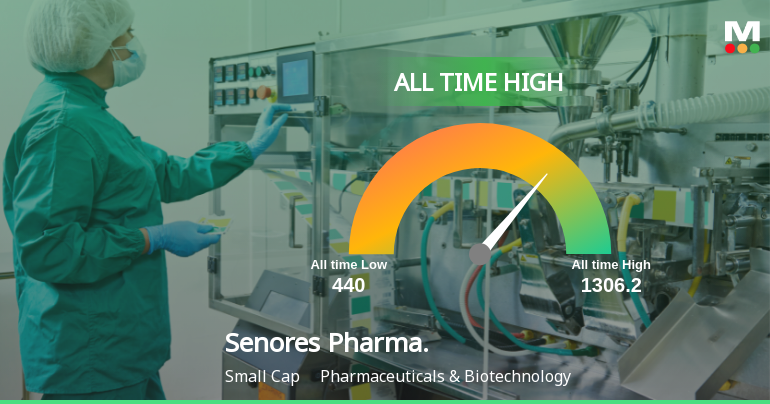
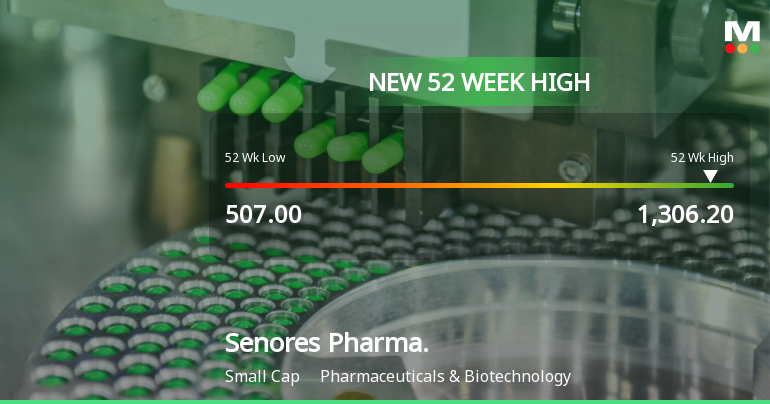
Broad-Based Technical Strength Lifts Senores Pharmaceuticals Ltd to 52-Week High of Rs 1306.2
With a remarkable ascent from Rs 507 to Rs 1306.2 over the past year, Senores Pharmaceuticals Ltd has more than doubled its share price, reaching a fresh 52-week high on 15 Jun 2026. This milestone underscores a sustained momentum driven by a confluence of robust technical indicators and steady fundamental growth.
Read full news article
Senores Pharmaceuticals Upgraded to Buy on Strong Technicals and Financial Momentum
Senores Pharmaceuticals Ltd has been upgraded from a Hold to a Buy rating, reflecting significant improvements across technical indicators, valuation metrics, financial trends, and overall quality. This upgrade comes amid robust stock price appreciation, strong quarterly results, and positive institutional interest, positioning the company favourably within the Pharmaceuticals & Biotechnology sector.
Read full news article Announcements
Announcement Under Regulation 30 Of SEBI (LODR) Regulations 2015
10-Jun-2026 | Source : BSESenores Pharmaceuticals Limited has informed the Exchange regarding update in terms of Regulation 30(5) of SEBI (LODR) Regulations 2015
Announcement under Regulation 30 (LODR)-Resignation of Company Secretary / Compliance Officer
10-Jun-2026 | Source : BSESenores Pharmaceuticals Limited has informed the Exchange regarding Cessation of Company Secretary and Compliance Offer w.e.f. June 10 2026
Announcement under Regulation 30 (LODR)-Analyst / Investor Meet - Intimation
09-Jun-2026 | Source : BSESenores Pharmaceuticals Limited has informed the Exchange regarding Analyst/Institutional Investor meet scheduled to be held on June 12 2026.
Corporate Actions

No Upcoming Board Meetings

No Dividend history available

No Splits history available

No Bonus history available

No Rights history available
Quality key factors
Valuation key factors
Technicals key factors
 Technical Indicator Scale: Bearish, Mildly Bearish, Sideways, Mildly Bullish, Bullish Turned
 Shareholding Snapshot : Mar 2026
Shareholding Compare (%holding)
Promoters
1.8957
Held by 5 Schemes (5.07%)
Held by 26 FIIs (3.64%)
Swapnil Jatin Shah (7.72%)
Aditya Birla Sun Life Insurance Company Limited (2.96%)
31.64%
Quarterly Results Snapshot (Consolidated) - Mar'26 - QoQ

QoQ Growth in quarter ended Mar 2026 is 2.48% vs 5.68% in Dec 2025

QoQ Growth in quarter ended Mar 2026 is -0.16% vs -2.22% in Dec 2025
Half Yearly Results Snapshot (Standalone) - Sep'25
Not Applicable: The company has declared_date for only one period
Not Applicable: The company has declared_date for only one period
Nine Monthly Results Snapshot (Standalone) - Dec'25
Not Applicable: The company has declared_date for only one period
Not Applicable: The company has declared_date for only one period
Annual Results Snapshot (Consolidated) - Mar'26
YoY Growth in year ended Mar 2026 is 58.85% vs 85.65% in Mar 2025
YoY Growth in year ended Mar 2026 is 96.99% vs 86.20% in Mar 2025
About Senores Pharmaceuticals Ltd

Company Coordinates


