
Compare SEPC with Similar Stocks
Dashboard
Weak Long Term Fundamental Strength with an average Return on Capital Employed (ROCE) of 1.42%
- Poor long term growth as Net Sales has grown by an annual rate of 12.59% over the last 5 years
- Company's ability to service its debt is weak with a poor EBIT to Interest (avg) ratio of 0.32
Flat results in Mar 26
71.45% of Promoter Shares are Pledged
Underperformed the market in the last 1 year
Total Returns (Price + Dividend) 
Latest dividend: 1.2 per share ex-dividend date: Sep-11-2012
Risk Adjusted Returns v/s
Returns Beta

News
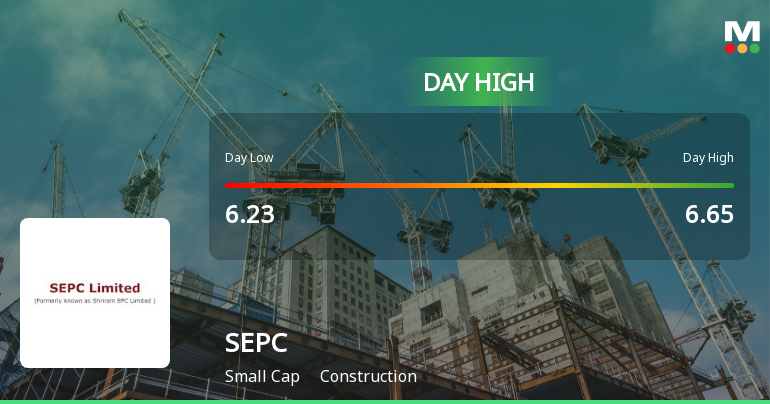
SEPC Ltd Surges 7.27% to Day's High — Outperforms Construction Sector by 5.49 Percentage Points
The Sensex advanced 0.97% on 12 Jun 2026, yet SEPC Ltd outpaced the broader market with a 7.27% gain, outperforming its sector by 5.49 percentage points. This sharp intraday rally stands out amid the stock’s recent weakness, raising the question of whether this is a genuine recovery or a short-lived bounce within a broader downtrend.
Read full news article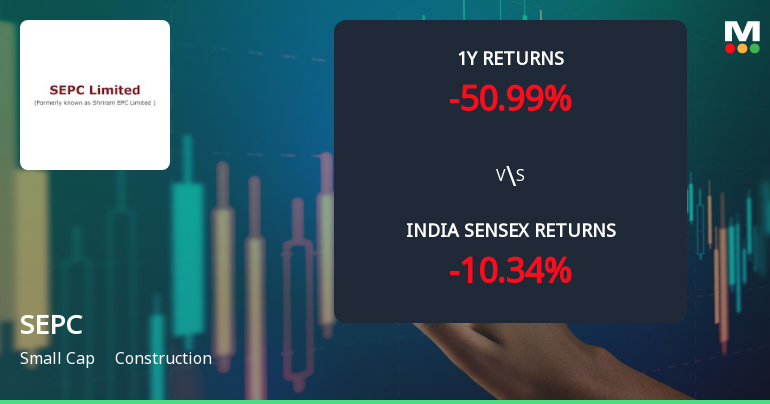
SEPC Ltd Technical Momentum Shifts Amid Bearish Outlook
SEPC Ltd, a small-cap player in the construction industry, has experienced a notable shift in its technical momentum, with key indicators signalling a predominantly bearish outlook. Despite a modest uptick in the daily price, the broader technical landscape reveals challenges ahead for investors as the stock grapples with downward pressure across multiple timeframes.
Read full news article
SEPC Ltd Upgraded to Sell as Technicals Improve Amidst Lingering Fundamental Concerns
SEPC Ltd, a small-cap player in the construction sector, has seen its investment rating upgraded from Strong Sell to Sell as of 8 June 2026, primarily driven by a shift in technical indicators. Despite this upgrade, the company continues to face significant challenges in its financial performance and long-term fundamentals, which weigh heavily on its overall outlook.
Read full news article Announcements
Compliances-Reg.24(A)-Annual Secretarial Compliance
29-May-2026 | Source : BSEWe hereby inform the exchange about the submission of Annual Secretarial Compliance Report for the Financial Year March 31 2026. Detailed letter enclosed.
Announcement under Regulation 30 (LODR)-Press Release / Media Release
26-May-2026 | Source : BSEWe hereby inform the exchange of the press release titled SEPC Limited Posts Stellar FY26 Results with Over 2x Jump in Net Profit and 68% Income Growth. Detailed letter is enclosed.
Announcement under Regulation 30 (LODR)-Monitoring Agency Report
25-May-2026 | Source : BSEWe herewith enclosed the Monitoring Agency Report for the Quarter ended March 31 2026. Detailed letter is enclosed.
Corporate Actions

No Upcoming Board Meetings

SEPC Ltd has declared 12% dividend, ex-date: 11 Sep 12

No Splits history available

No Bonus history available

SEPC Ltd has announced 11:50 rights issue, ex-date: 23 May 25
Quality key factors
Valuation key factors
Technicals key factors
 Technical Indicator Scale: Bearish, Mildly Bearish, Sideways, Mildly Bullish, Bullish Turned
 Shareholding Snapshot : Mar 2026
Shareholding Compare (%holding)
Non Institution
71.4528
Held by 1 Schemes (0.0%)
Held by 27 FIIs (0.96%)
Mark Ab Welfare Trust (18.62%)
Punjab National Bank (4.95%)
56.92%
Quarterly Results Snapshot (Consolidated) - Mar'26 - QoQ

QoQ Growth in quarter ended Mar 2026 is -19.69% vs 43.61% in Dec 2025
QoQ Growth in quarter ended Mar 2026 is -8.22% vs 80.24% in Dec 2025
Half Yearly Results Snapshot (Consolidated) - Sep'25
Growth in half year ended Sep 2025 is 26.78% vs 27.29% in Sep 2024

Growth in half year ended Sep 2025 is 139.63% vs -1.98% in Sep 2024
Nine Monthly Results Snapshot (Consolidated) - Dec'25
YoY Growth in nine months ended Dec 2025 is 62.69% vs 16.14% in Dec 2024
YoY Growth in nine months ended Dec 2025 is 168.80% vs -8.07% in Dec 2024
Annual Results Snapshot (Consolidated) - Mar'26
YoY Growth in year ended Mar 2026 is 76.44% vs 6.54% in Mar 2025
YoY Growth in year ended Mar 2026 is 115.54% vs 9.04% in Mar 2025
About SEPC Ltd

Company Coordinates


