
Compare Servotech Renew with Similar Stocks
Dashboard
With ROCE of 11.4, it has a Expensive valuation with a 4.6 Enterprise value to Capital Employed
- The stock is trading at a discount compared to its peers' average historical valuations
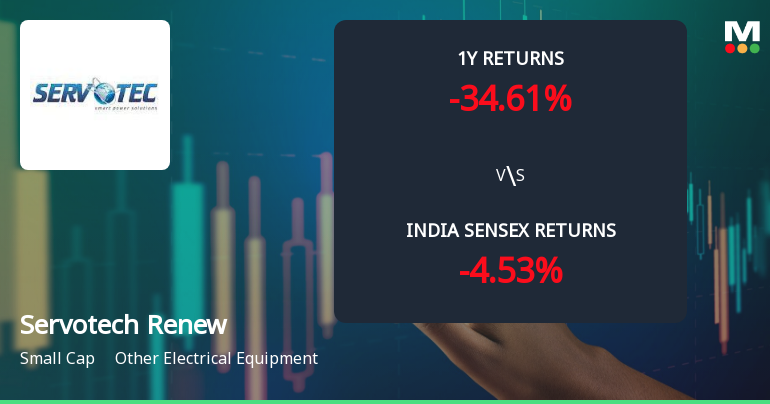
- Over the past year, while the stock has generated a return of -100.00%, its profits have risen by 11.8% ; the PEG ratio of the company is 4.4
Despite the size of the company, domestic mutual funds hold only 0% of the company
Below par performance in long term as well as near term
Stock DNA
Other Electrical Equipment
INR 2,055 Cr (Small Cap)
49.00
52
0.05%
0.49
11.65%
7.24
Total Returns (Price + Dividend) 
Latest dividend: 0.05 per share ex-dividend date: Sep-23-2025
Risk Adjusted Returns v/s
Returns Beta

News
Servotech Renewable Power System Ltd Faces Mildly Bearish Momentum Amid Technical Shifts
Servotech Renewable Power System Ltd has experienced a notable shift in its technical momentum, transitioning from a sideways trend to a mildly bearish stance. This change is reflected across key indicators such as MACD, RSI, moving averages, and other momentum oscillators, signalling a cautious outlook for investors amid mixed signals and a recent downgrade in its Mojo Grade to Sell.
Read full news article
Servotech Renewable Power System Ltd Faces Technical Momentum Shift Amid Mixed Indicators
Servotech Renewable Power System Ltd, a small-cap player in the Other Electrical Equipment sector, has experienced a notable shift in its technical momentum, prompting a downgrade in its Mojo Grade from Hold to Sell. The stock’s recent price action and technical indicators reveal a complex picture of mixed signals, with some metrics suggesting mild bullishness while others point towards bearish tendencies. This article analyses the evolving technical landscape and what it means for investors navigating this stock’s trajectory.
Read full news article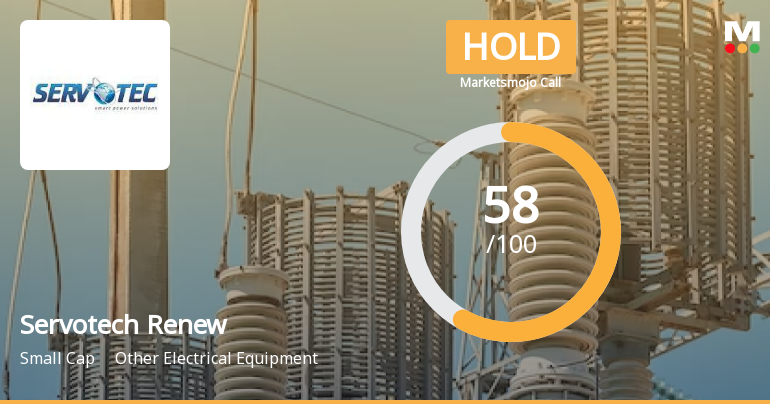
Servotech Renewable Power System Ltd is Rated Hold
Servotech Renewable Power System Ltd is rated 'Hold' by MarketsMOJO, with this rating last updated on 19 June 2026. However, the analysis and financial metrics discussed here reflect the stock's current position as of 28 July 2026, providing investors with an up-to-date view of the company’s fundamentals, returns, and market standing.
Read full news article Announcements
Servotech Power Systems Limited - Reply to Clarification- Financial results
22-Nov-2019 | Source : NSEServotech Power Systems Limitedvotech Power Systems Limited for the quarter ended 30-Sep-2019 with respect to Regulation 33 of the SEBI (Listing Obligations and Disclosure Requirements) Regulations, 2015.
Servotech Power Systems Limited - Updates
15-Nov-2019 | Source : NSEServotech Power Systems Limited has informed the Exchange regarding 'Announcement for planning for launching new products'.
Servotech Power Systems Limited - Disclosure under SEBI Takeover Regulations
16-Oct-2019 | Source : NSEServotech Power Systems Limited has informed the Exchange regarding reason for encumbrance vide letter dated October 15, 2019 under SEBI ( SAST) Regulations, 2011.
Corporate Actions

No Upcoming Board Meetings

Servotech Renewable Power System Ltd has declared 5% dividend, ex-date: 23 Sep 25

Servotech Renewable Power System Ltd has announced 1:2 stock split, ex-date: 28 Jul 23

No Bonus history available

No Rights history available
Quality key factors
Valuation key factors
Technicals key factors
 Technical Indicator Scale: Bearish, Mildly Bearish, Sideways, Mildly Bullish, Bullish Turned
 Shareholding Snapshot : Jun 2026
Shareholding Compare (%holding)
Promoters
4.2424
Held by 0 Schemes
Held by 4 FIIs (0.05%)
Raman Bhatia (29.91%)
Mahesh Dinkar Vaze (0%)
34.32%
Quarterly Results Snapshot (Consolidated) - Jun'26 - YoY

YoY Growth in quarter ended Jun 2026 is 57.81% vs 21.88% in Jun 2025
YoY Growth in quarter ended Jun 2026 is 74.62% vs 16.96% in Jun 2025
Half Yearly Results Snapshot (Consolidated) - Sep'25

Growth in half year ended Sep 2025 is -22.00% vs 88.44% in Sep 2024
Growth in half year ended Sep 2025 is -58.37% vs 118.56% in Sep 2024
Nine Monthly Results Snapshot (Consolidated) - Dec'25
YoY Growth in nine months ended Dec 2025 is -13.98% vs 142.82% in Dec 2024
YoY Growth in nine months ended Dec 2025 is -14.72% vs 199.40% in Dec 2024
Annual Results Snapshot (Consolidated) - Mar'26
YoY Growth in year ended Mar 2026 is -0.42% vs 90.69% in Mar 2025
YoY Growth in year ended Mar 2026 is 2.47% vs 178.40% in Mar 2025
About Servotech Renewable Power System Ltd

Company Coordinates


