
Compare Servotech Renew with Similar Stocks
Dashboard
Flat results in Mar 26
- DEBT-EQUITY RATIO(HY) Highest at 0.73 times
- DEBTORS TURNOVER RATIO(HY) Lowest at 3.36 times
- INTEREST(Q) Highest at Rs 4.10 cr
With ROCE of 11.4, it has a Expensive valuation with a 5.7 Enterprise value to Capital Employed
Falling Participation by Institutional Investors
Below par performance in long term as well as near term
Stock DNA
Other Electrical Equipment
INR 2,340 Cr (Small Cap)
69.00
NA
0.05%
0.49
11.65%
8.04
Total Returns (Price + Dividend) 
Latest dividend: 0.05 per share ex-dividend date: Sep-23-2025
Risk Adjusted Returns v/s
Returns Beta

News
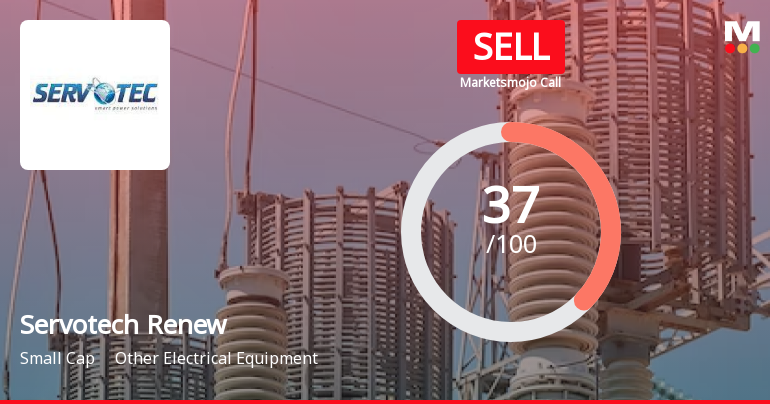
Servotech Renewable Power System Ltd is Rated Sell
Servotech Renewable Power System Ltd is rated 'Sell' by MarketsMOJO, with this rating last updated on 24 April 2026. However, the analysis and financial metrics presented here reflect the stock's current position as of 14 June 2026, providing investors with the most up-to-date view of the company’s fundamentals, returns, and technical outlook.
Read full news article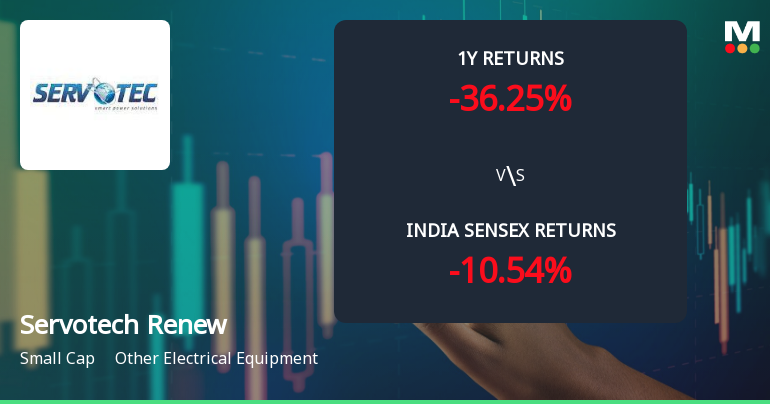
Servotech Renewable Power System Ltd Technical Momentum Shifts Amid Mixed Indicator Signals
Servotech Renewable Power System Ltd has experienced a notable shift in its technical parameters, reflecting a complex interplay of bullish and bearish signals across multiple timeframes. Despite a recent downgrade in its Mojo Grade to 'Sell', the stock’s price momentum and technical indicators reveal a nuanced outlook that investors should carefully analyse.
Read full news article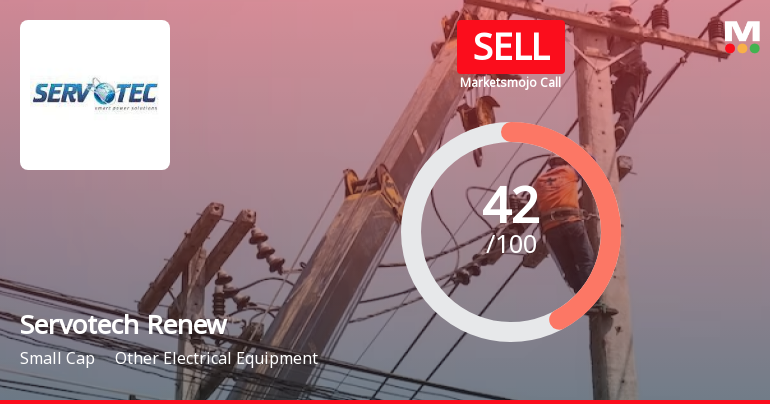
Servotech Renewable Power System Ltd is Rated Sell
Servotech Renewable Power System Ltd is rated Sell by MarketsMOJO. This rating was last updated on 24 April 2026, reflecting a change from a previous Strong Sell to the current Sell status. However, all fundamentals, returns, and financial metrics discussed below are based on the stock’s position as of 03 June 2026, providing investors with the latest comprehensive view of the company’s performance and outlook.
Read full news article Announcements
Servotech Power Systems Limited - Reply to Clarification- Financial results
22-Nov-2019 | Source : NSEServotech Power Systems Limitedvotech Power Systems Limited for the quarter ended 30-Sep-2019 with respect to Regulation 33 of the SEBI (Listing Obligations and Disclosure Requirements) Regulations, 2015.
Servotech Power Systems Limited - Updates
15-Nov-2019 | Source : NSEServotech Power Systems Limited has informed the Exchange regarding 'Announcement for planning for launching new products'.
Servotech Power Systems Limited - Disclosure under SEBI Takeover Regulations
16-Oct-2019 | Source : NSEServotech Power Systems Limited has informed the Exchange regarding reason for encumbrance vide letter dated October 15, 2019 under SEBI ( SAST) Regulations, 2011.
Corporate Actions

No Upcoming Board Meetings

Servotech Renewable Power System Ltd has declared 5% dividend, ex-date: 23 Sep 25

Servotech Renewable Power System Ltd has announced 1:2 stock split, ex-date: 28 Jul 23

No Bonus history available

No Rights history available
Quality key factors
Valuation key factors
Technicals key factors
 Technical Indicator Scale: Bearish, Mildly Bearish, Sideways, Mildly Bullish, Bullish Turned
 Shareholding Snapshot : Mar 2026
Shareholding Compare (%holding)
Promoters
4.2423
Held by 0 Schemes
Held by 10 FIIs (0.14%)
Raman Bhatia (29.91%)
Mahesh Dinkar Vaze (3.28%)
34.3%
Quarterly Results Snapshot (Consolidated) - Mar'26 - YoY

YoY Growth in quarter ended Mar 2026 is 48.57% vs 7.42% in Mar 2025

YoY Growth in quarter ended Mar 2026 is 57.64% vs 127.11% in Mar 2025
Half Yearly Results Snapshot (Consolidated) - Sep'25
Growth in half year ended Sep 2025 is -22.00% vs 88.44% in Sep 2024
Growth in half year ended Sep 2025 is -58.37% vs 118.56% in Sep 2024
Nine Monthly Results Snapshot (Consolidated) - Dec'25
YoY Growth in nine months ended Dec 2025 is -13.98% vs 142.82% in Dec 2024
YoY Growth in nine months ended Dec 2025 is -14.72% vs 199.40% in Dec 2024
Annual Results Snapshot (Consolidated) - Mar'26
YoY Growth in year ended Mar 2026 is -0.42% vs 90.69% in Mar 2025
YoY Growth in year ended Mar 2026 is 2.47% vs 178.40% in Mar 2025
About Servotech Renewable Power System Ltd

Company Coordinates


