
Compare Seshasayee Paper with Similar Stocks
Stock DNA
Paper, Forest & Jute Products
INR 1,427 Cr (Micro Cap)
17.00
16
0.89%
-0.07
4.04%
0.70
Total Returns (Price + Dividend) 
Latest dividend: 2 per share ex-dividend date: Jun-10-2026
Risk Adjusted Returns v/s
Returns Beta

News
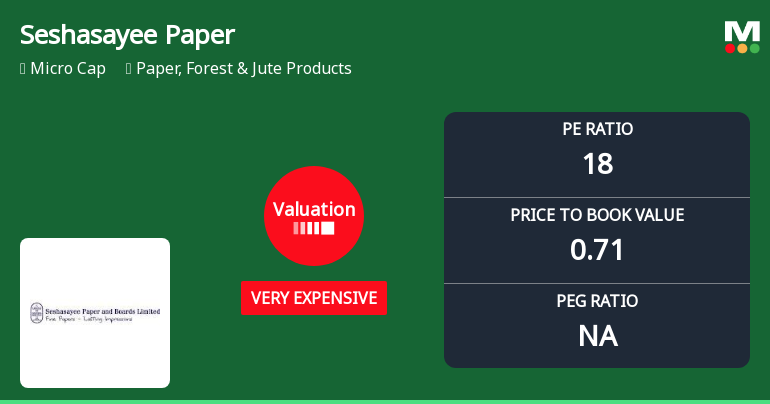
Seshasayee Paper & Boards Ltd Valuation Shifts Signal Elevated Price Risk
Seshasayee Paper & Boards Ltd, a micro-cap player in the Paper, Forest & Jute Products sector, has seen its valuation parameters shift notably, with its price-to-earnings (P/E) ratio rising to 17.52, marking a transition from expensive to very expensive territory. This change accompanies a downgrade in its MarketsMOJO Mojo Grade from Hold to Sell, reflecting growing concerns about the stock’s price attractiveness relative to its fundamentals and peers.
Read full news article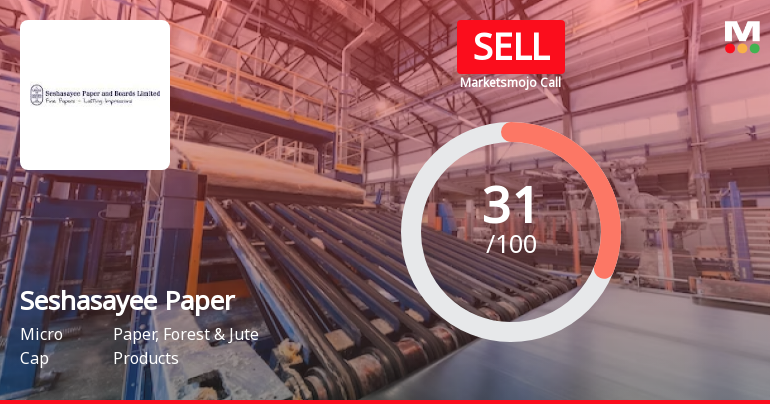
Seshasayee Paper & Boards Ltd is Rated Sell
Seshasayee Paper & Boards Ltd is rated 'Sell' by MarketsMOJO, with this rating last updated on 18 May 2026. However, the analysis and financial metrics presented here reflect the stock's current position as of 10 June 2026, providing investors with an up-to-date view of the company’s fundamentals, returns, and market standing.
Read full news article
Seshasayee Paper & Boards Ltd Faces Bearish Momentum Amid Technical Downgrade
Seshasayee Paper & Boards Ltd has experienced a notable shift in its technical momentum, with key indicators signalling a bearish trend. The company’s recent downgrade from a Hold to a Sell rating reflects deteriorating price action and weakening market sentiment amid broader sector challenges.
Read full news article Announcements
Letter To Shareholders - Annual Report 2025-26 Web Link
30-May-2026 | Source : BSELetter to Shareholders who have not registered their e-mail Id advising them the web-link and exact path of our website to access the Annual report for the Financial Year 2025-26.
Announcement under Regulation 30 (LODR)-Newspaper Publication
29-May-2026 | Source : BSEIntimation of dispatch of Annual Report for the Financial Year 2025-26 to Shareholders.
Annual General Meeting
26-May-2026 | Source : BSEIntimation of Annual General Meeting to be held on June 20 2026
Corporate Actions

No Upcoming Board Meetings

Seshasayee Paper & Boards Ltd has declared 100% dividend, ex-date: 10 Jun 26

Seshasayee Paper & Boards Ltd has announced 2:10 stock split, ex-date: 19 Aug 19

No Bonus history available

No Rights history available
Quality key factors
Valuation key factors
Technicals key factors
 Technical Indicator Scale: Bearish, Mildly Bearish, Sideways, Mildly Bullish, Bullish Turned
 Shareholding Snapshot : Mar 2026
Shareholding Compare (%holding)
Promoters
None
Held by 1 Schemes (0.0%)
Held by 47 FIIs (12.94%)
Ponni Sugars (erode) Limited (14.02%)
The Tamil Nadu Industrial Investment Corpn Ltd (14.27%)
20.21%
Quarterly Results Snapshot (Consolidated) - Mar'26 - YoY

YoY Growth in quarter ended Mar 2026 is 17.81% vs -6.87% in Mar 2025
YoY Growth in quarter ended Mar 2026 is -3.77% vs -52.38% in Mar 2025
Half Yearly Results Snapshot (Consolidated) - Sep'25

Growth in half year ended Sep 2025 is -10.84% vs 4.03% in Sep 2024
Growth in half year ended Sep 2025 is -42.20% vs -54.83% in Sep 2024
Nine Monthly Results Snapshot (Consolidated) - Dec'25
YoY Growth in nine months ended Dec 2025 is -10.66% vs -0.82% in Dec 2024
YoY Growth in nine months ended Dec 2025 is -31.21% vs -61.62% in Dec 2024
Annual Results Snapshot (Consolidated) - Mar'26
YoY Growth in year ended Mar 2026 is -2.50% vs -2.63% in Mar 2025
YoY Growth in year ended Mar 2026 is -24.40% vs -59.68% in Mar 2025
About Seshasayee Paper & Boards Ltd

Company Coordinates


