SG Mart

  • Market Cap: Small Cap
  • Industry: Construction
  • ISIN: INE385F01024
  • NSEID: SGMART
  • BSEID: 512329
INR
344.95
-1.8 (-0.52%)
BSENSE

Dec 05

BSE+NSE Vol: 39.29 k

  • Price Points
  • Score
  • Mojo Parameters
  • Total Return
  • News and Corporate Actions
  • Key factors
  • Shareholding
  • Financials
  • CompanyCV
stock-summaryPrice Point
High/Low

1Day

52 Week

Valuation
Technical
Day's Volume

CASH

39.29 k (67.68%) Volume

Shareholding (Sep 2025)

FII

1.16%

Held by 11 FIIs

DII

4.74%

Held by 1 DIIs

Promoter

36.27%

Who are in the management team of SG Mart?

06-Jun-2025

As of March 2022, the management team of SG Mart includes P K Singh (Independent Director), Khushboo Singhal (Non Executive Director), Arihant Copra (Independent Director), Sachin Kumar (Company Secretary & Compliance Officer), and Shivkumar Niranjanlal Bansal (Whole Time Director & Additional Director).

As of March 2022, the management team of SG Mart includes the following individuals:<BR><BR>1. P K Singh - Independent Director<BR>2. Khushboo Singhal - Non Executive Director<BR>3. Arihant Copra - Independent Director<BR>4. Sachin Kumar - Company Secretary & Compliance Officer<BR>5. Shivkumar Niranjanlal Bansal - Whole Time Director & Additional Director<BR><BR>These members play various roles within the company’s governance and management structure.

Read More

What is the bonus history of the SG Mart?

06-Jun-2025

SG Mart recently announced a 1:1 bonus issue, with both the record date and ex-date set for February 22, 2024, meaning shareholders will receive an additional share for each share held.

SG Mart has a recent bonus issue announced at a ratio of 1:1, with both the record date and ex-date set for February 22, 2024. This means that for every share held, shareholders will receive an additional share. This is the latest information regarding their bonus history. If you have any more questions about SG Mart or need further details, feel free to ask!

Read More

Has SG Mart declared dividend?

06-Jun-2025

SG Mart Ltd has declared a 10% dividend, with an ex-date of September 20, 2021. While the company has shown significant price returns over the years, it has not consistently provided dividend returns in recent periods.

SG Mart Ltd has declared a 10% dividend.<BR><BR>Dividend Details:<BR>- Percentage announced: 10%<BR>- Ex-date: 20 Sep 21<BR><BR>Dividend Yield: 0%<BR><BR>Total Returns by Period:<BR>In the 6-month period, the price return was -1.02%, the dividend return was 0%, resulting in a total return of -1.02%.<BR><BR>For the 1-year period, the price return was -12.99%, the dividend return was 0%, leading to a total return of -12.99%.<BR><BR>Over the 2-year period, the price return was 438.5%, with a dividend return of 0%, resulting in a total return of 438.5%.<BR><BR>In the 3-year period, the price return was 1586.96%, the dividend return was 0%, culminating in a total return of 1586.96%.<BR><BR>For the 4-year period, the price return was 6108.0%, with a dividend return of 16.00%, resulting in a total return of 6124.0%.<BR><BR>In the 5-year period, the price return was 7125.33%, the dividend return was 18.62%, leading to a total return of 7143.95%.<BR><BR>Overall, SG Mart Ltd has declared a dividend but has not consistently provided dividend returns in recent periods. The total returns, especially over longer periods, show significant growth in price returns, indicating strong performance despite the lack of dividends in many periods.

Read More

Who are the peers of the SG Mart?

03-Jun-2025

SG Mart's peers include Larsen & Toubro, Rail Vikas, Altius Telecom, NBCC, IRB Infra.Devl., Interarch Build., Ramky Infra, Patel Engineering, and NDR INVIT Trust, with varying management and growth risks. Notably, NBCC has the highest 1-year return at 24.25%, while SG Mart's return is -11.06%.

Peers: The peers of SG Mart are Larsen & Toubro, Rail Vikas, Altius Telecom, NBCC, IRB Infra.Devl., Interarch Build., Ramky Infra, Patel Engineerin, NDR INVIT Trust.<BR><BR>Quality Snapshot: Excellent management risk is observed at NBCC and Interarch Build., while Good management risk is found at Larsen & Toubro. Average management risk is noted for Rail Vikas and IRB Infra.Devl., and the rest have Below Average management risk. In terms of growth, Excellent growth is seen at Altius Telecom, SG Mart, and NDR INVIT Trust, while Good growth is noted for NBCC, Ramky Infra, and Patel Engineerin. Average growth is found at Rail Vikas and IRB Infra.Devl., and the rest have Below Average growth. For capital structure, Excellent capital structure is observed at NBCC and Interarch Build., Good capital structure is noted for SG Mart, while Below Average capital structure is found at Larsen & Toubro, Altius Telecom, IRB Infra.Devl., Ramky Infra, Patel Engineerin, and the rest.<BR><BR>Return Snapshot: The peer with the highest 1-year return is NBCC at 24.25%, while the lowest is IRB Infra.Devl. at -29.88%. SG Mart's 1-year return is -11.06%, which is higher than IRB Infra.Devl. but lower than NBCC. Additionally, the peers with negative six-month returns include IRB Infra.Devl., Patel Engineerin, and Ramky Infra.

Read More

What does SG Mart do?

17-Jul-2025

SG Mart Ltd is a small-cap company in the construction industry, previously known as Jarigold Textiles and Kintech Renewables. As of March 2025, it reported net sales of ₹15,950 Cr and a net profit of ₹331 Cr.

Overview:<BR>SG Mart Ltd is a company operating in the construction industry and is categorized as a small-cap entity.<BR><BR>History:<BR>SG Mart Ltd was originally incorporated as 'Jarigold Textiles Limited' in April 1985. The company underwent name changes, first to 'Kintech Renewables Limited' on August 22, 2015, and then to 'SG Mart Limited' on October 7, 2023. The most recent quarterly results reported net sales and net profit for the period ending March 2025.<BR><BR>Financial Snapshot:<BR>- Net Sales: 15,950 Cr (Quarterly Results - Mar 2025)<BR>- Net Profit: 331 Cr (Quarterly Results - Mar 2025)<BR>- Market Cap: INR 4,129 Cr (Small Cap)<BR><BR>Key Metrics:<BR>- P/E: 46.00<BR>- Industry P/E: 23<BR>- Dividend Yield: 0.00%<BR>- Debt Equity: -0.28<BR>- Return on Equity: 7.84%<BR>- Price to Book: 3.42<BR><BR>Contact Details:<BR>Address: Kintech House 8 Shivalik Plaza, Opp AMA IIM Road Ahmedabad Gujarat : 380015<BR>Tel: 91-79-26303064-74<BR>Email: amica_ad1@sancharnet.in<BR>Website: http://www.kintechrenewables.com

Read More

Who are the top shareholders of the SG Mart?

17-Jul-2025

The top shareholders of SG Mart are Dhruv Gupta with 27.22%, Neera Gupta with 8.86%, and individual investors holding 40.82%. Additionally, 8 foreign institutional investors own 0.91%, and there are no pledged promoter holdings.

The top shareholders of SG Mart include Dhruv Gupta, who holds the largest stake at 27.22%. Following him, Neera Gupta is the highest public shareholder with an 8.86% ownership. Additionally, individual investors collectively hold 40.82% of the company's shares. There are also 8 foreign institutional investors (FIIs) with a combined holding of 0.91%, and one mutual fund scheme that holds 0.0%. Notably, there are no pledged promoter holdings.

Read More

When is the next results date for SG Mart?

18-Jul-2025

The next results date for SG Mart is 25 July 2025.

The next results date for SG Mart is scheduled for 25 July 2025.

Read More

Is SG Mart overvalued or undervalued?

25-Jul-2025

As of July 24, 2025, SG Mart is fairly valued with a PE ratio of 44.03 and has outperformed the Sensex over three years with a return of 1656.06%, despite a recent decline in stock price.

As of 24 July 2025, the valuation grade for SG Mart has moved from expensive to fair. The company is currently fairly valued. Key ratios include a PE ratio of 44.03, an EV to EBITDA of 45.42, and a PEG ratio of 0.83. In comparison, K P R Mill Ltd is categorized as very expensive with a PE ratio of 52.07, while Trident is considered fair with a PE ratio of 43.43.<BR><BR>Despite SG Mart's recent performance showing a decline in stock price, it has significantly outperformed the Sensex over the long term, with a 3-year return of 1656.06% compared to the Sensex's 46.57%. This long-term performance suggests that while the current valuation appears fair, the company's growth potential remains strong.

Read More

How big is SG Mart?

24-Jul-2025

As of 24th July, SG Mart Ltd has a market capitalization of 4,149.00 Cr, with net sales of 5,889.71 Cr and a net profit of 103.40 Cr for the latest four quarters. The company reported shareholder's funds of 1,086.99 Cr and total assets of 1,486.95 Cr for the annual period ending March 2024.

As of 24th July, SG Mart Ltd has a market capitalization of 4,149.00 Cr, categorizing it as a Small Cap company.<BR><BR>In the latest four quarters, SG Mart reported net sales of 5,889.71 Cr and a net profit of 103.40 Cr.<BR><BR>For the latest annual period ending March 2024, the company had shareholder's funds amounting to 1,086.99 Cr and total assets of 1,486.95 Cr.

Read More

Are SG Mart latest results good or bad?

30-Oct-2025

SG Mart's latest results show a 66.39% year-on-year net profit growth, reaching ₹26.54 crore, but a 17.86% sequential decline raises concerns about sustainability. While revenue increased 49% quarter-on-quarter, it declined 4.94% year-on-year, indicating mixed performance and reliance on non-operating income, suggesting investors should be cautious.

SG Mart's latest results present a mixed picture. On one hand, the company achieved a significant year-on-year net profit growth of 66.39%, reaching ₹26.54 crore in Q2 FY26. This is a positive indicator of profitability compared to the same quarter last year. However, there is a notable sequential decline of 17.86% in net profit compared to the previous quarter, which raises concerns about the sustainability of this profit growth.<BR><BR>Revenue for the quarter was ₹1,704.25 crore, reflecting a sharp 49.00% increase quarter-on-quarter, but a decline of 4.94% year-on-year. This indicates that while the company has bounced back from the previous quarter, it is struggling to maintain consistent revenue growth compared to the same period last year.<BR><BR>Operating margins have also been under pressure, with an operating margin of 1.64%, which is an improvement from the previous year but a decline from the prior quarter. The profit after tax margin of 1.56% shows improvement year-on-year but remains below the previous quarter's 2.82%.<BR><BR>Additionally, SG Mart's reliance on other income, which constituted over half of its pre-tax profits, raises questions about the core operational strength of the business. This dependency on non-operating income can mask underlying challenges in generating sustainable profits from its primary construction activities.<BR><BR>Overall, while there are positive aspects such as year-on-year profit growth and a strong quarterly rebound, the sequential declines and reliance on other income suggest that the results are not entirely favorable. Investors should approach with caution, considering both the growth potential and the operational challenges the company faces.

Read More

How has been the historical performance of SG Mart?

03-Dec-2025

SG Mart experienced significant growth from March 2024 to March 2025, with net sales rising to 5,856.17 Cr and profit after tax increasing to 103.43 Cr. However, cash flow from operating activities declined to -391.00 Cr, indicating challenges in cash generation despite overall profitability.

Answer:<BR>The historical performance of SG Mart shows significant growth in net sales and profitability over the years, particularly from March 2024 to March 2025.<BR><BR>Breakdown:<BR>SG Mart's net sales surged to 5,856.17 Cr in March 2025, a substantial increase from 2,682.90 Cr in March 2024, reflecting a remarkable growth trajectory. The total operating income mirrored this trend, reaching 5,856.17 Cr in March 2025, up from 2,682.90 Cr the previous year. Operating profit (PBDIT) also saw a notable rise to 183.29 Cr in March 2025, compared to 93.45 Cr in March 2024. Profit before tax increased to 137.32 Cr in March 2025 from 81.31 Cr in March 2024, leading to a profit after tax of 103.43 Cr, up from 60.94 Cr. The company's total assets grew to 2,298.42 Cr in March 2025, up from 1,486.95 Cr in March 2024, while total liabilities also increased to 2,298.42 Cr from 1,486.95 Cr. Cash flow from operating activities, however, showed a negative trend at -391.00 Cr in March 2025, down from 29.00 Cr in March 2024, indicating challenges in cash generation despite the growth in sales and profits.

Read More

Is SG Mart technically bullish or bearish?

04-Dec-2025

As of December 3, 2025, SG Mart's technical trend has shifted to mildly bearish, influenced by bearish MACD readings, Bollinger Bands signals, and a mixed KST, despite some short-term support from daily moving averages.

As of 3 December 2025, the technical trend for SG Mart has changed from mildly bullish to mildly bearish. The current technical stance is mildly bearish, driven primarily by the weekly and monthly MACD readings indicating bearish momentum, along with bearish signals from the Bollinger Bands across both time frames. The KST shows a mixed signal with weekly mildly bullish but monthly mildly bearish, while the daily moving averages remain mildly bullish, suggesting some short-term support. The OBV is mildly bearish on the weekly chart, contributing to the overall bearish sentiment. The lack of clear trends in the Dow Theory further supports the neutral to bearish outlook.

Read More

Should I buy, sell or hold SG Mart?

04-Dec-2025

Why is SG Mart falling/rising?

04-Dec-2025

As of 04-Dec, SG Mart Ltd's stock price is declining, with a recent change of -0.4 and a total decrease of -1.39% over the last three days. The stock is underperforming compared to the Sensex and is trading below its moving averages, indicating a bearish trend.

As of 04-Dec, SG Mart Ltd's stock price is currently falling, as indicated by a change of -0.4, which represents a decline of 0.12%. This downward movement is part of a broader trend, as the stock has been losing value for the last three days, resulting in a total decrease of -1.39% during this period. Additionally, SG Mart's performance over the past week shows a decline of -0.91%, which is worse than the benchmark Sensex, which fell only -0.53%.<BR><BR>The stock is also trading below its moving averages across various time frames, including the 5-day, 20-day, 50-day, 100-day, and 200-day averages, indicating a bearish trend. Despite a slight increase in delivery volume, which rose by 0.7% against the 5-day average, the overall sentiment remains negative, as evidenced by the year-to-date performance of -6.54%, significantly underperforming the Sensex, which has gained 9.12% in the same period. These factors collectively contribute to the current decline in SG Mart's stock price.

Read More
iScoreScore
Click here to find our call on this stock
Strong Sell
Sell
Hold
Buy
Strong Buy

MarketsMojo — Loved in India, Now Global

The power of Mojo is now in 29 countries. Explore global equities with the same cutting-edge features you love.

Dashboard
1

Falling Participation by Institutional Investors
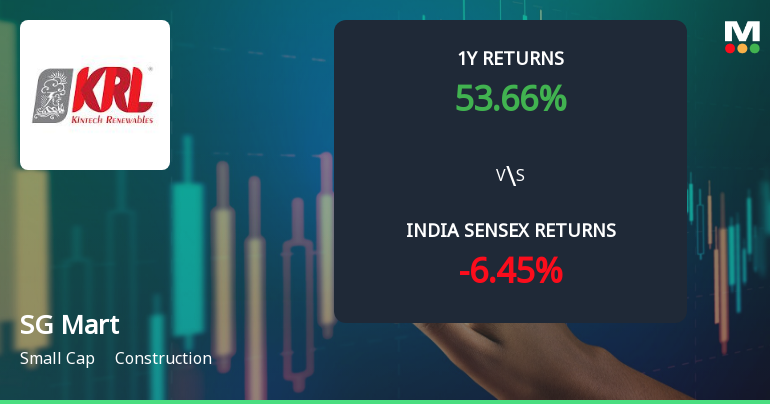
  • Institutional investors have decreased their stake by -0.71% over the previous quarter and collectively hold 5.9% of the company
  • These investors have better capability and resources to analyse fundamentals of companies than most retail investors
2

Underperformed the market in the last 1 year

stock-summaryMojo Parameters
Mojo Parameters
Loading Valuation Snapshot...
Stock DNA
stock-summary
Industry

Construction

stock-summary
Market cap

INR 4,346 Cr (Small Cap)

stock-summary
P/E

36.00

stock-summary
Industry P/E

22

stock-summary
Dividend Yield

0.00%

stock-summary
Debt Equity

-0.54

stock-summary
Return on Equity

7.86%

stock-summary
Price to Book

2.86

Revenue and Profits:
Net Sales:
1,704 Cr
(Quarterly Results - Sep 2025)
Net Profit:
27 Cr
stock-summaryTotal Returns
Total Returns (Price + Dividend) stock-summary
Dividend Yield (0%)
TimePeriod
Price Return
Dividend Return
Total Return
3 Months
-4.78%
0%
-4.78%
6 Months
-10.4%
0%
-10.4%
1 Year
-11.55%
0%
-11.55%
2 Years
-14.3%
0%
-14.3%
3 Years
1512.48%
0%
1512.48%
4 Years
1746.87%
0%
1746.87%
5 Years
7239.36%
20.24%
7259.6%

Latest dividend: 1 per share ex-dividend date: Sep-20-2021

Risk Adjusted Returns v/s stock-summary
Returns Beta
Icon
Beta has not been calculated since enough price history is not available
stock-summaryNews & Corporate Actions
News

Is SG Mart technically bullish or bearish?

Recent Technical Trend Shift

As of 3 December 2025, SG Mart’s technical trend has transitioned from mildly bullish to mildly bearish. This change signals a cautious stance among traders and analysts, reflecting a potential shift in momentum. The mildly bearish classification suggests that while the stock is not in a strong downtrend, there are emerging signs of weakness that investors should consider.

Key Technical Indicators Overview

Examining the core technical indicators provides a clearer picture of SG Mart’s current market sentiment:

Announcements stock-summary

Disclosures under Reg. 10(5) in respect of acquisition under Reg. 10(1)(a) of SEBI (SAST) Regulations 2011

03-Nov-2025 | Source : BSE

The Exchange has received the disclosure under Regulation 10(5) in respect of acquisition under Regulation 10(1)(a) of SEBI (Substantial Acquisition of Shares & Takeovers) Regulations 2011 for Sameer Gupta

Announcement under Regulation 30 (LODR)-Earnings Call Transcript

03-Nov-2025 | Source : BSE

Transcript of the Conference Call held on October 31 2025

Announcement under Regulation 30 (LODR)-Newspaper Publication

31-Oct-2025 | Source : BSE

Newspaper publication of Unaudited Financial Results for the quarter and half year ended September 30 2025

Corporate Actions stock-summary
stock-summary
BOARD MEETING

No Upcoming Board Meetings

stock-summary
DIVIDEND

SG Mart Ltd has declared 10% dividend, ex-date: 20 Sep 21

stock-summary
SPLITS

SG Mart Ltd has announced 1:10 stock split, ex-date: 22 Feb 24

stock-summary
BONUS

SG Mart Ltd has announced 1:1 bonus issue, ex-date: 22 Feb 24

stock-summary
RIGHTS

No Rights history available

stock-summaryKey Factors
Quality key factors stock-summary
Factor
Value
Sales Growth (5y)
453.13%
EBIT Growth (5y)
143.73%
EBIT to Interest (avg)
4.36
Debt to EBITDA (avg)
3.17
Net Debt to Equity (avg)
-0.54
Sales to Capital Employed (avg)
1.70
Tax Ratio
22.70%
Dividend Payout Ratio
0
Pledged Shares
0
Institutional Holding
5.90%
ROCE (avg)
2.83%
ROE (avg)
27.17%
Valuation key factors
Factor
Value
P/E Ratio
36
Industry P/E
22
Price to Book Value
2.86
EV to EBIT
30.33
EV to EBITDA
28.93
EV to Capital Employed
5.00
EV to Sales
0.61
PEG Ratio
NA
Dividend Yield
NA
ROCE (Latest)
16.49%
ROE (Latest)
7.86%
Technicals key factors
Indicator
Weekly
Monthly
MACD
Bearish
Mildly Bearish
RSI
No Signal
No Signal
Bollinger Bands
Bearish
Bearish
Moving Averages
Mildly Bullish (Daily)
KST
Mildly Bullish
Mildly Bearish
Dow Theory
No Trend
No Trend
OBV
Mildly Bearish
No Trend
stock-summary Technical Indicator Scale: Bearish, Mildly Bearish, Sideways, Mildly Bullish, Bullish  Turned 
stock-summaryShareholding
Shareholding Snapshot : Sep 2025stock-summary
Shareholding Compare (%holding) stock-summary
Majority shareholders

Non Institution

Pledged Promoter Holdings

None

Mutual Funds

Held by 1 Schemes (0.0%)

FIIs

Held by 11 FIIs (1.16%)

Promoter with highest holding

Dhruv Gupta (27.22%)

Highest Public shareholder

Neera Gupta (8.86%)

Individual Investors Holdings

46.17%

stock-summaryFinancial
[
  {
    "link": "quarterly",
    "btn_text": "All Quarterly Results",
    "header": "Quarterly Results Snapshot (Consolidated) - Sep'25 - YoY",
    "rhs": [
      {
        "prefix": "Net Sales ",
        "suffix": "YoY Growth in quarter ended Sep 2025 is -4.94% vs 254.15% in Sep 2024",
        "dir": -1
      },
      {
        "prefix": "Consolidated Net Profit ",
        "suffix": "YoY Growth in quarter ended Sep 2025 is 66.39% vs 78.21% in Sep 2024",
        "dir": -1
      }
    ],
    "table": {
      "header": [
        "Sep'25",
        "Sep'24",
        "Change(%)"
      ],
      "body": [
        {
          "field": "Net Sales",
          "val1": "1,704.25",
          "val2": "1,792.83",
          "chgp": "-4.94%",
          "chgp_class": "negative"
        },
        {
          "field": "Operating Profit (PBDIT) excl Other Income",
          "val1": "28.02",
          "val2": "14.95",
          "chgp": "87.42%",
          "chgp_class": "positive"
        },
        {
          "field": "Interest",
          "val1": "11.54",
          "val2": "12.79",
          "chgp": "-9.77%",
          "chgp_class": "positive"
        },
        {
          "field": "Exceptional Items",
          "val1": "0.00",
          "val2": "0.00",
          "chgp": "",
          "chgp_class": "neutral"
        },
        {
          "field": "Consolidate Net Profit",
          "val1": "26.54",
          "val2": "15.95",
          "chgp": "66.39%",
          "chgp_class": "positive"
        },
        {
          "field": "Operating Profit Margin (Excl OI)",
          "val1": "1.64%",
          "val2": "0.83%",
          "chgp": "0.81%",
          "chgp_class": "positive"
        }
      ]
    }
  },
  {
    "link": "half-yearly",
    "btn_text": "All Half Yearly Results",
    "header": "Half Yearly Results Snapshot (Consolidated) - Sep'25",
    "rhs": [
      {
        "prefix": "Net Sales ",
        "suffix": " Growth in half year ended Sep 2025 is -2.68% vs 345.36% in Sep 2024",
        "dir": -1
      },
      {
        "prefix": "Consolidated Net Profit ",
        "suffix": " Growth in half year ended Sep 2025 is 39.32% vs 312.71% in Sep 2024",
        "dir": -1
      }
    ],
    "table": {
      "header": [
        "Sep'25",
        "Sep'24",
        "Change(%)"
      ],
      "body": [
        {
          "field": "Net Sales",
          "val1": "2,848.01",
          "val2": "2,926.44",
          "chgp": "-2.68%",
          "chgp_class": "negative"
        },
        {
          "field": "Operating Profit (PBDIT) excl Other Income",
          "val1": "63.90",
          "val2": "39.64",
          "chgp": "61.20%",
          "chgp_class": "positive"
        },
        {
          "field": "Interest",
          "val1": "23.56",
          "val2": "20.50",
          "chgp": "14.93%",
          "chgp_class": "negative"
        },
        {
          "field": "Exceptional Items",
          "val1": "0.00",
          "val2": "0.00",
          "chgp": "",
          "chgp_class": "neutral"
        },
        {
          "field": "Consolidate Net Profit",
          "val1": "58.82",
          "val2": "42.22",
          "chgp": "39.32%",
          "chgp_class": "positive"
        },
        {
          "field": "Operating Profit Margin (Excl OI)",
          "val1": "2.24%",
          "val2": "1.35%",
          "chgp": "0.89%",
          "chgp_class": "positive"
        }
      ]
    }
  },
  {
    "link": "nine-monthly",
    "btn_text": "All Nine Monthly Results",
    "header": "Nine Monthly Results Snapshot (Consolidated) - Dec'24",
    "rhs": [
      {
        "prefix": "Net Sales ",
        "suffix": "YoY Growth in nine months ended Dec 2024 is 203.21% vs 0.00% in Dec 2023",
        "dir": 1
      },
      {
        "prefix": "Consolidated Net Profit ",
        "suffix": "YoY Growth in nine months ended Dec 2024 is 156.24% vs 9,355.17% in Dec 2023",
        "dir": -1
      }
    ],
    "table": {
      "header": [
        "Dec'24",
        "Dec'23",
        "Change(%)"
      ],
      "body": [
        {
          "field": "Net Sales",
          "val1": "4,261.15",
          "val2": "1,405.36",
          "chgp": "203.21%",
          "chgp_class": "positive"
        },
        {
          "field": "Operating Profit (PBDIT) excl Other Income",
          "val1": "61.39",
          "val2": "30.09",
          "chgp": "104.02%",
          "chgp_class": "positive"
        },
        {
          "field": "Interest",
          "val1": "30.29",
          "val2": "3.76",
          "chgp": "705.59%",
          "chgp_class": "negative"
        },
        {
          "field": "Exceptional Items",
          "val1": "0.00",
          "val2": "0.00",
          "chgp": "",
          "chgp_class": "neutral"
        },
        {
          "field": "Consolidate Net Profit",
          "val1": "70.26",
          "val2": "27.42",
          "chgp": "156.24%",
          "chgp_class": "positive"
        },
        {
          "field": "Operating Profit Margin (Excl OI)",
          "val1": "1.44%",
          "val2": "2.14%",
          "chgp": "-0.70%",
          "chgp_class": "negative"
        }
      ]
    }
  },
  {
    "link": "annual",
    "btn_text": "All Annual Results",
    "header": "Annual Results Snapshot (Consolidated) - Mar'25",
    "rhs": [
      {
        "prefix": "Net Sales ",
        "suffix": "Not Applicable: The company has declared_date for only one period",
        "dir": 0
      },
      {
        "prefix": "Consolidated Net Profit ",
        "suffix": "Not Applicable: The company has declared_date for only one period",
        "dir": 0
      }
    ],
    "table": {
      "header": [
        "Mar'25",
        "Mar'24",
        "Change(%)"
      ],
      "body": [
        {
          "field": "Net Sales",
          "val1": "5,856.17",
          "val2": "2,682.90",
          "chgp": "118.28%",
          "chgp_class": "positive"
        },
        {
          "field": "Operating Profit (PBDIT) excl Other Income",
          "val1": "103.09",
          "val2": "61.82",
          "chgp": "66.76%",
          "chgp_class": "positive"
        },
        {
          "field": "Interest",
          "val1": "43.89",
          "val2": "11.63",
          "chgp": "277.39%",
          "chgp_class": "negative"
        },
        {
          "field": "Exceptional Items",
          "val1": "0.00",
          "val2": "0.00",
          "chgp": "",
          "chgp_class": "neutral"
        },
        {
          "field": "Consolidate Net Profit",
          "val1": "103.43",
          "val2": "60.94",
          "chgp": "69.72%",
          "chgp_class": "positive"
        },
        {
          "field": "Operating Profit Margin (Excl OI)",
          "val1": "1.76%",
          "val2": "2.30%",
          "chgp": "-0.54%",
          "chgp_class": "negative"
        }
      ]
    }
  }
]
Quarterly Results Snapshot (Consolidated) - Sep'25 - YoYstock-summary
Sep'25
Sep'24
Change(%)
Net Sales
1,704.25
1,792.83
-4.94%
Operating Profit (PBDIT) excl Other Income
28.02
14.95
87.42%
Interest
11.54
12.79
-9.77%
Exceptional Items
0.00
0.00
Consolidate Net Profit
26.54
15.95
66.39%
Operating Profit Margin (Excl OI)
1.64%
0.83%
0.81%
Values in Rs Cr.
Direction Arrows
Net Sales

YoY Growth in quarter ended Sep 2025 is -4.94% vs 254.15% in Sep 2024

Direction Arrows
Consolidated Net Profit

YoY Growth in quarter ended Sep 2025 is 66.39% vs 78.21% in Sep 2024

Half Yearly Results Snapshot (Consolidated) - Sep'25stock-summary
Sep'25
Sep'24
Change(%)
Net Sales
2,848.01
2,926.44
-2.68%
Operating Profit (PBDIT) excl Other Income
63.90
39.64
61.20%
Interest
23.56
20.50
14.93%
Exceptional Items
0.00
0.00
Consolidate Net Profit
58.82
42.22
39.32%
Operating Profit Margin (Excl OI)
2.24%
1.35%
0.89%
Values in Rs Cr.
Direction Arrows
Net Sales

Growth in half year ended Sep 2025 is -2.68% vs 345.36% in Sep 2024

Direction Arrows
Consolidated Net Profit

Growth in half year ended Sep 2025 is 39.32% vs 312.71% in Sep 2024

Nine Monthly Results Snapshot (Consolidated) - Dec'24stock-summary
Dec'24
Dec'23
Change(%)
Net Sales
4,261.15
1,405.36
203.21%
Operating Profit (PBDIT) excl Other Income
61.39
30.09
104.02%
Interest
30.29
3.76
705.59%
Exceptional Items
0.00
0.00
Consolidate Net Profit
70.26
27.42
156.24%
Operating Profit Margin (Excl OI)
1.44%
2.14%
-0.70%
Values in Rs Cr.
Direction Arrows
Net Sales

YoY Growth in nine months ended Dec 2024 is 203.21% vs 0.00% in Dec 2023

Direction Arrows
Consolidated Net Profit

YoY Growth in nine months ended Dec 2024 is 156.24% vs 9,355.17% in Dec 2023

Annual Results Snapshot (Consolidated) - Mar'25stock-summary
Mar'25
Mar'24
Change(%)
Net Sales
5,856.17
2,682.90
118.28%
Operating Profit (PBDIT) excl Other Income
103.09
61.82
66.76%
Interest
43.89
11.63
277.39%
Exceptional Items
0.00
0.00
Consolidate Net Profit
103.43
60.94
69.72%
Operating Profit Margin (Excl OI)
1.76%
2.30%
-0.54%
Values in Rs Cr.
Net Sales

Not Applicable: The company has declared_date for only one period

Consolidated Net Profit

Not Applicable: The company has declared_date for only one period

stock-summaryCompany CV
About SG Mart Ltd stock-summary
stock-summary
SG Mart Ltd
Small Cap
Construction
SG Mart Limited was originally incorporated in the name of 'Jarigold Textiles Limited' in April, 1985. Thereafter, the Company name was changed from 'Jarigold Textiles Limited' to 'Kintech Renewables Limited' on August 22, 2015 and again changed from 'Kintech Renewables Limited' to 'SG Mart Limited' on October 7, 2023.
Company Coordinates stock-summary
Company Details
Kintech House 8 Shivalik Plaza, Opp AMA IIM Road Ahmedabad Gujarat : 380015
stock-summary
Tel: 91-79-26303064-74
stock-summary
amica_ad1@sancharnet.in
Registrar Details
MCS Share Transfer Agent Ltd., Formerly MCS Ltd., 12/1/5, Monoharpukar Road, Kolkata