
Compare Sh. Karthik Pap. with Similar Stocks
Dashboard
With HIgh Debt (Debt-Equity Ratio at 7.98 times)- the company has a Weak Long Term Fundamental Strength
- Poor long term growth as Net Sales has grown by an annual rate of 27.51% and Operating profit at 0% over the last 5 years
- The company is Net-Debt Free
Flat results in Mar 26
With ROCE of 0.9, it has a Expensive valuation with a 1.4 Enterprise value to Capital Employed
Underperformed the market in the last 1 year
Stock DNA
Paper, Forest & Jute Products
INR 14 Cr (Micro Cap)
471.00
17
0.00%
7.98
1.01%
4.77
Total Returns (Price + Dividend) 
Sh. Karthik Pap. for the last several years.
Risk Adjusted Returns v/s
Returns Beta

News
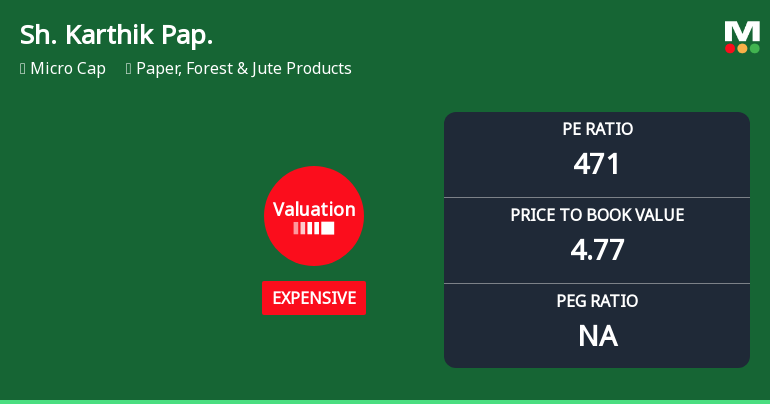
Shree Karthik Papers Ltd Valuation Shifts Signal Elevated Price Risk
Shree Karthik Papers Ltd, a micro-cap player in the Paper, Forest & Jute Products sector, has seen a marked shift in its valuation parameters, moving from fair to expensive territory. With a price-to-earnings (P/E) ratio soaring to 470.74 and a price-to-book value (P/BV) at 4.77, investors face heightened valuation risk amid subdued profitability metrics and a challenging sector backdrop.
Read full news article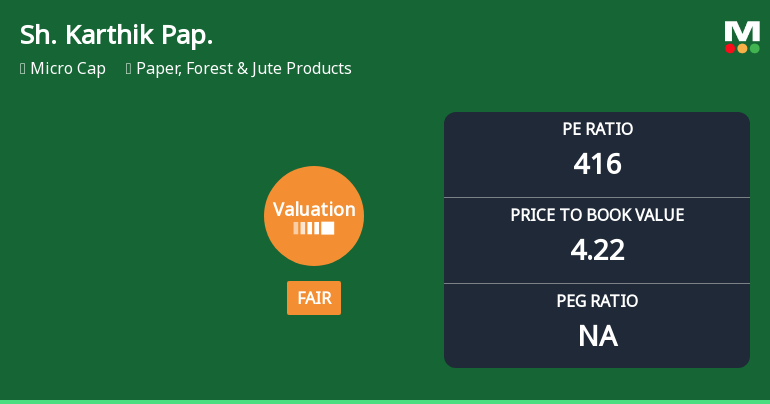
Shree Karthik Papers Ltd Valuation Shifts to Fair Amidst Elevated Price Multiples
Shree Karthik Papers Ltd, a micro-cap player in the Paper, Forest & Jute Products sector, has recently undergone a notable shift in its valuation parameters, moving from a risky to a fair valuation grade. Despite a challenging market environment and a Mojo Score downgrade to a Strong Sell, the company’s price-to-earnings (P/E) and price-to-book value (P/BV) ratios reveal a complex picture when analysed against historical trends and peer benchmarks.
Read full news articleAre Shree Karthik Papers Ltd latest results good or bad?
Shree Karthik Papers Ltd's latest financial results for Q4 FY26 indicate a notable return to profitability, with a net profit of ₹0.29 crores compared to a loss of ₹0.33 crores in the previous quarter. This marks a significant operational improvement, as the company also achieved a revenue of ₹16.74 crores, reflecting a year-on-year growth of 17.97% and the highest quarterly revenue in at least seven quarters. The operating margin improved to 3.29%, a substantial recovery from the negative margin reported in the previous quarter. Despite these positive operational metrics, the company continues to face significant challenges. The debt-to-equity ratio remains high at 7.65 times, indicating considerable leverage and potential financial risk. The balance sheet shows minimal shareholder funds of ₹2.61 crores, coupled with negative reserves of ₹6.94 crores, reflecting accumulated losses that raise concerns abou...
Read full news article Announcements
Closure of Trading Window
26-Jun-2026 | Source : BSEThe closure of Trading window letter is attached herewith for taking on record.
Disclosure under Regulation 30A of LODR
07-Jun-2026 | Source : BSEBSE has called for explanation delaying of submission of Outcome of Board Meeting on 27/05/26. Reply has already submitted through email id of Query LODR and the same is attached for your records and drop further proceedings in this regard
Format of the Annual Disclosure to be made by an entity identified as a LC - Annexure B2
23-Apr-2026 | Source : BSEFormat of the Annual Disclosure to be made by an entity identified as a Large Corporate.
| Sr. No. | Particulars | Details |
| 1 | Name of Company | Shree Karthik Papers Ltd |
| 2 | CIN NO. | L21012TZ1991PLC003570 |
| 3 | Report filed for FY | 2025-2026 |
| Details of the Current block (all figures in Rs crore): | ||
| 4 | 2 - year block period (Specify financial years)* | 2024-25 25-26 |
| 5 | Incremental borrowing done in FY (T)(a) | 0.00 |
| 6 | Mandatory borrowing to be done through debt securities in FY (T) (b) = (25% of a) | 0.00 |
| 7 | Actual borrowing done through debt securities in FY (T)(c) | 0.00 |
| 8 | Shortfall in the borrowing through debt securities if any for FY (T - 1) carried forward to FY (T) (d) | 0 |
| 8 | Quantum of (d) which has been met from (c)(e)* | 0 |
| 9 | Shortfall if any in the mandatory borrowing through debt securities for FY (T) { after adjusting for any shortfall in borrowing for FY(T - 1) which was carried forward to FY(T)}(f) = (b) - [(c) - (e)]{ If the calculated value is zero or negative write nil}* | 0 |
| Details of penalty to be paid if any in respect to previous block (all figures in Rs crore): | |
| 2 - year Block period (Specify financial years) | 2024-25 25-26 |
| Amount of fine to be paid for the block if applicable Fine = 0.2% of {(d) - (e)}# | 0.00 |
| Name of the Company Secretary :- | V Rajan |
| Designation :- | Company Secretary and Compliance Officer |
| Name of the Chief Financial Officer :- | Ranisri |
| Designation : - | Chief Financial Officer |
Date: 23/04/2026
Corporate Actions

No Upcoming Board Meetings

No Dividend history available

No Splits history available

No Bonus history available

No Rights history available
Quality key factors
Valuation key factors
Technicals key factors
 Technical Indicator Scale: Bearish, Mildly Bearish, Sideways, Mildly Bullish, Bullish Turned
 Shareholding Snapshot : Mar 2026
Shareholding Compare (%holding)
Promoters
None
Held by 2 Schemes (0.14%)
Held by 1 FIIs (0.5%)
Smt. Selvambal (74.46%)
Kamal Kumar Goyal (1.52%)
21.08%
Quarterly Results Snapshot (Standalone) - Mar'26 - YoY

YoY Growth in quarter ended Mar 2026 is 17.97% vs -2.94% in Mar 2025
YoY Growth in quarter ended Mar 2026 is 178.38% vs 0.00% in Mar 2025
Half Yearly Results Snapshot (Standalone) - Sep'25
Growth in half year ended Sep 2025 is 8.18% vs -16.82% in Sep 2024

Growth in half year ended Sep 2025 is 5.41% vs 12.12% in Sep 2024
Nine Monthly Results Snapshot (Standalone) - Dec'25
YoY Growth in nine months ended Dec 2025 is 6.49% vs -13.18% in Dec 2024
YoY Growth in nine months ended Dec 2025 is -86.36% vs -37.14% in Dec 2024
Annual Results Snapshot (Standalone) - Mar'26
YoY Growth in year ended Mar 2026 is 9.31% vs -10.86% in Mar 2025
YoY Growth in year ended Mar 2026 is 78.95% vs -44.12% in Mar 2025
About Shree Karthik Papers Ltd

Company Coordinates


