
Key Events This Week
May 27: Q4 FY26 results reveal extraordinary other income masking operational weakness
May 29: Valuation shifts signal elevated risk amid price gains
May 29: Week closes at Rs.5.03 (-0.40%) vs Sensex +0.01%
Jun 12, 02:08 PM
BSE+NSE Vol: 1.29 cr
Iron & Steel Products
INR 456 Cr (Micro Cap)
38.00
26
0.00%
0.78
3.99%
1.52
Shah Metacorp for the last several years.

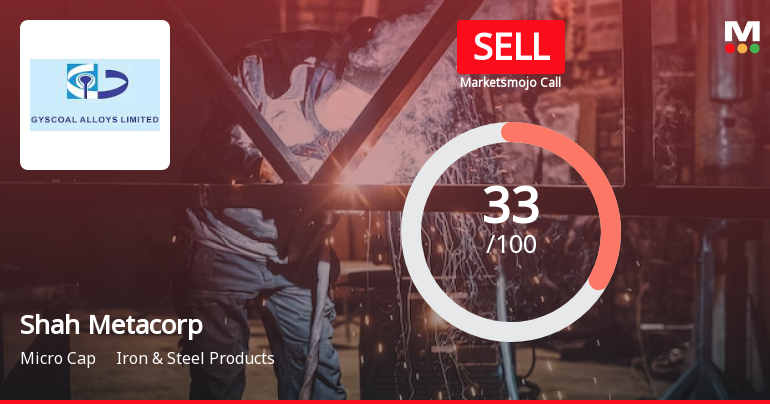
Shah Metacorp Ltd is rated 'Sell' by MarketsMOJO, with this rating last updated on 09 Oct 2025. However, the analysis and financial metrics discussed here reflect the company’s current position as of 10 June 2026, providing investors with an up-to-date view of its fundamentals, returns, and market standing.
Read full news article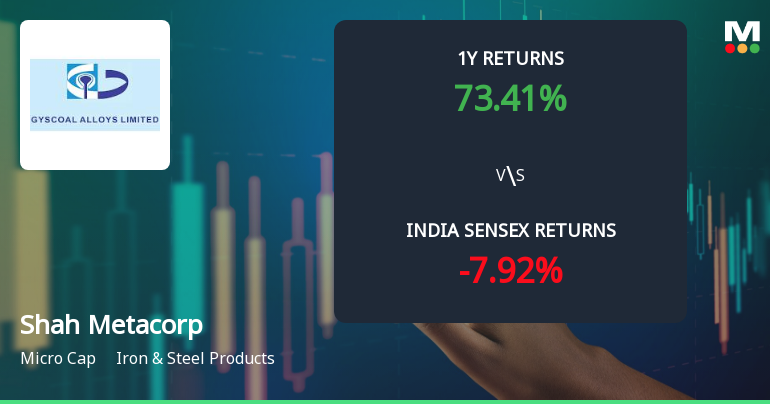
Shah Metacorp Ltd, a micro-cap player in the Iron & Steel Products sector, has witnessed a notable shift in its technical momentum, moving from a mildly bullish stance to a more confident bullish trend. This change is underscored by improvements across key technical indicators including MACD, moving averages, and Bollinger Bands, signalling renewed investor interest and potential upside after a period of consolidation.
Read full news articleIntimation as per Regulation 84 of Securities and Exchange Board of India (Issue of Capital and Disclosure Requirements) 2018 (SEBI ICDR Regulations) - Issue of advertisement in newspapers in respect of certain matters relating to rights issue of fully paid-up equity shares of the Shah Metacorp Limited (Company).
With reference to above we are enclosing copy of Advertisement for Financial Results published in Business Standard (English) and Jai Hind (Gujarati) on May 28 2026 for the quarter and Financial year ended March 31 2026 of Shah Metacorp Limited pursuant to Regulation 47 of Securities and Exchange Board of India (Listing Obligations and Disclosure Requirements) Regulations 2015 for your information.
Pursuant to Regulation 24A of SEBI (Listing Obligations and Disclosure Requirements) Regulations 2015 read with the SEBI Master Circular No. SEBI/HO/CFD/PoD2/CIR/P/0155 dated November 11 2024 and as amended up to date please find enclosed the Annual Secretarial Compliance Report for the financial year ended March 31 2026 issued by M/s. Mehul Raval & Associates Practicing Company Secretary dated May 28 2026. This is for your information and record please.

No Upcoming Board Meetings

No Dividend history available

Shah Metacorp Ltd has announced 1:10 stock split, ex-date: 13 Oct 16

No Bonus history available

Shah Metacorp Ltd has announced 36:311 rights issue, ex-date: 27 May 26
 Technical Indicator Scale: Bearish, Mildly Bearish, Sideways, Mildly Bullish, Bullish Turned
 Non Institution
None
Held by 0 Schemes
Held by 0 FIIs
Mona Viral Shah (12.04%)
Malavkumar Kalpesh Shah (16.96%)
40.17%

QoQ Growth in quarter ended Mar 2026 is 24.46% vs -25.06% in Dec 2025
QoQ Growth in quarter ended Mar 2026 is 1,101.45% vs -2.82% in Dec 2025

Growth in half year ended Sep 2025 is 0.89% vs 152.34% in Sep 2024
Growth in half year ended Sep 2025 is -87.60% vs 1,183.58% in Sep 2024
YoY Growth in nine months ended Dec 2025 is 8.18% vs 166.77% in Dec 2024
YoY Growth in nine months ended Dec 2025 is -86.49% vs 935.97% in Dec 2024
YoY Growth in year ended Mar 2026 is 18.07% vs 91.75% in Mar 2025
YoY Growth in year ended Mar 2026 is -62.67% vs 42.30% in Mar 2025


