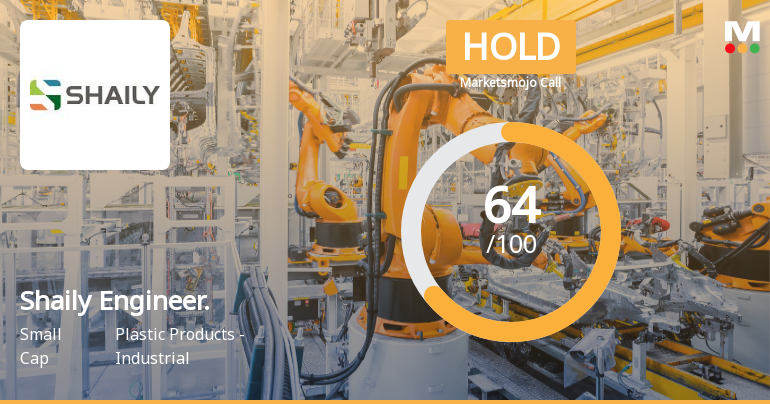
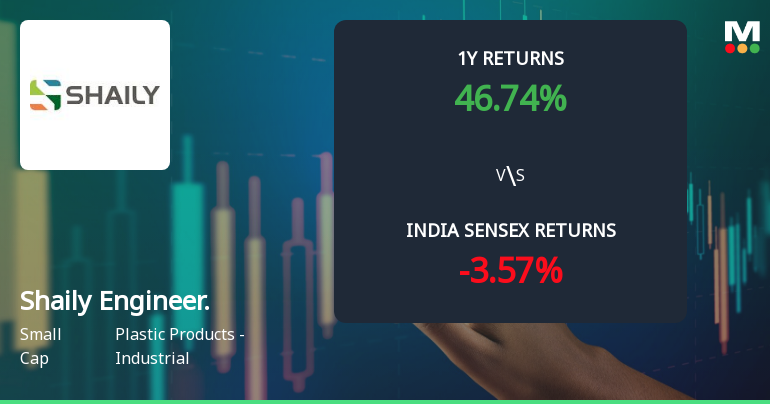
Shaily Engineer.

  • Market Cap: Small Cap
  • Industry: Plastic Products - Industrial
  • ISIN: INE151G01028
  • NSEID: SHAILY
  • BSEID: 501423
INR
2,736.90
41.7 (1.55%)
BSENSE

May 25

BSE+NSE Vol: 1.28 lacs

  • Price Points
  • Score
  • Mojo Parameters
  • Total Return
  • News and Corporate Actions
  • Key factors
  • Shareholding
  • Financials
  • CompanyCV
stock-summaryPrice Point
High/Low

1Day

52 Week

Valuation
Technical
Day's Volume

CASH

1.28 lacs (-54.24%) Volume

Shareholding (Mar 2026)

FII

16.74%

Held by 122 FIIs

DII

10.61%

Held by 12 DIIs

Promoter

43.40%

Is Shaily Engineer. overvalued or undervalued?

09-Jun-2025

As of January 29, 2024, Shaily Engineer is considered very expensive and overvalued with a PE ratio of 86.50, an EV to EBITDA of 46.69, and a Price to Book Value of 14.71, significantly higher than its peers, despite a strong 1-year return of 171.80%.

As of 29 January 2024, the valuation grade for Shaily Engineer has moved from expensive to very expensive, indicating a significant shift in its market perception. The company is currently considered overvalued based on its high valuation metrics. Key ratios include a PE ratio of 86.50, an EV to EBITDA of 46.69, and a Price to Book Value of 14.71, all of which are considerably elevated compared to industry norms.<BR><BR>In comparison to its peers, Shaily Engineer's PE ratio far exceeds that of Supreme Industries at 57.34 and Astral at 78.35, both of which are also categorized as very expensive. Additionally, its EV to EBITDA ratio is higher than that of Finolex Industries, which stands at 24.37, indicating that Shaily Engineer is trading at a premium relative to its competitors. Despite a strong performance with a 1-year return of 171.80% compared to the Sensex's 7.65%, the current valuation metrics suggest that the stock is overvalued in the current market environment.

View full answer

how big is Shaily Engineer.?

06-Jun-2025

As of October 2023, Shaily Engineering Plastics Ltd has a market capitalization of ₹8,129.00 Cr, with recent net sales of ₹786.80 Cr and a net profit of ₹93.12 Cr over the last four quarters.

Market Cap: Shaily Engineering Plastics Ltd has a market capitalization of 8,129.00 Cr and is classified as a Mid Cap company.<BR><BR>Recent Quarterly Performance: The sum of Net Sales for the latest 4 quarters, which includes data from March 2025, December 2024, September 2024, and June 2024, is 786.80 Cr. The sum of Net Profit for the same period is 93.12 Cr. This data is Consolidated.<BR><BR>Balance Sheet Snapshot: This is Consolidated data for the latest annual period ending March 2024. The Shareholder's Funds are reported at 459.17 Cr, and the Total Assets amount to 782.46 Cr.

View full answer

Who are in the management team of Shaily Engineer.?

06-Jun-2025

As of March 2023, the management team of Shaily Engineer includes Mahendra Sanghvi (Executive Chairman), Amit Sanghvi (Managing Director), and several independent directors, overseeing the company's operations and governance.

As of March 2023, the management team of Shaily Engineer consists of the following individuals:<BR><BR>1. Mahendra Sanghvi - Executive Chairman<BR>2. Laxman Sanghvi - Executive Director<BR>3. Tilottama Sanghvi - Whole-time Director<BR>4. Amit Sanghvi - Managing Director<BR>5. Milin Mehta - Non-Executive & Independent Director<BR>6. Ranjit Singh - Non-Executive & Independent Director<BR>7. Shailesh Ayyangar - Non-Executive & Independent Director<BR>8. Samaresh Parida - Independent Director<BR>9. Sangeeta Singh - Independent Director<BR>10. Dimple Mehta - Company Secretary & Compliance Officer<BR><BR>This team oversees the operations and governance of the company.

View full answer

What does Shaily Engineer. do?

06-Jun-2025

Shaily Engineering Plastics Ltd, established in 1987, specializes in precision engineering plastic molded components and operates in the mid-cap segment of the industrial plastic products industry, with a market cap of Rs 8,204 Cr and a net profit of 29 Cr for the quarter ending March 2025. Key metrics include a P/E of 89.00 and a return on equity of 17.00%.

Overview:<BR>Shaily Engineering Plastics Ltd specializes in providing precision engineering plastic molded components and operates within the mid-cap segment of the Plastic Products - Industrial industry.<BR><BR>History:<BR>Shaily Engineering Plastics Ltd was established in 1987 by Mike Sanghvi. The latest quarterly results reported net sales and profit for the period ending March 2025.<BR><BR>Financial Snapshot:<BR>Net Sales: 218 Cr (Quarterly Results - Mar 2025) <BR>Net Profit: 29 Cr (Quarterly Results - Mar 2025) <BR>Market Cap: Rs 8,204 Cr (Mid Cap)<BR><BR>Key Metrics:<BR>P/E: 89.00 <BR>Industry P/E: 41 <BR>Dividend Yield: 0.06% <BR>Debt Equity: 0.30 <BR>Return on Equity: 17.00% <BR>Price to Book: 15.11 <BR><BR>Contact Details:<BR>Address: Survey 364/366, Post Rania Taluka Savil Vadodara Gujarat : 391780 <BR>Tel: 91-2667-244307/348/361 <BR>Email: investors@shaily.com <BR>Website: http://www.shaily.com

View full answer

Has Shaily Engineer. declared dividend?

06-Jun-2025

Shaily Engineering Plastics Ltd has declared a 50% dividend, amounting to ₹1 per share, with an ex-date of September 13, 2024. Despite low dividend yields, the company has shown strong total returns, including a 2816.72% return over the last 5 years.

Shaily Engineering Plastics Ltd has declared a 50% dividend.<BR><BR>Dividend Details:<BR>- Percentage announced: 50%<BR>- Amount per share: 1 per share<BR>- Ex-date: 13 Sep 24<BR><BR>Dividend Yield: 0.06%.<BR><BR>Total Returns by Period:<BR>In the last 6 months, the price return was 36.62%, with a dividend return of 0%, resulting in a total return of 36.62%.<BR><BR>Over the past year, the price return reached 186.3%, with a dividend return of 0.15%, leading to a total return of 186.45%.<BR><BR>In the last 2 years, the price return was 591.33%, while the dividend return was 0.31%, culminating in a total return of 591.64%.<BR><BR>For the 3-year period, the price return stood at 365.98%, with a dividend return of 0.28%, resulting in a total return of 366.26%.<BR><BR>In the 4-year span, the price return was 483.8%, with a dividend return of 0.31%, leading to a total return of 484.11%.<BR><BR>Over the last 5 years, the price return soared to 2815.38%, while the dividend return was 1.34%, culminating in a total return of 2816.72%.<BR><BR>Overall, Shaily Engineering Plastics Ltd has declared a dividend while also showcasing impressive total returns across various periods, indicating strong performance despite relatively low dividend returns in the shorter terms.

View full answer

Who are the peers of the Shaily Engineer.?

03-Jun-2025

Shaily Engineer's peers include Supreme Inds., Astral, Finolex Inds., Garware Hi Tech, Time Technoplast, Kingfa Science, Jain Irrigation, Prince Pipes, Apollo Pipes, and Jai Corp. Shaily Engineer shows excellent growth and management risk, with the highest 1-year return at 199.86%.

Peers: The peers of Shaily Engineer are Supreme Inds., Astral, Finolex Inds., Garware Hi Tech, Time Technoplast, Kingfa Science, Jain Irrigation, Prince Pipes, Apollo Pipes, and Jai Corp.<BR><BR>Quality Snapshot: Excellent management risk is observed at Supreme Inds. and Kingfa Science, while Good management risk is found at Astral, Finolex Inds., Time Technoplast, Prince Pipes, and Apollo Pipes, and Average management risk is noted at Garware Hi Tech. Below Average management risk is present at Jain Irrigation and Jai Corp. In terms of Growth, Excellent growth is seen at Kingfa Science, while Good growth is found at Astral, Shaily Engineer, and Jain Irrigation. Average growth is observed at Supreme Inds. and Garware Hi Tech, and Below Average growth is noted at Finolex Inds., Time Technoplast, Prince Pipes, and Apollo Pipes. Capital Structure ratings show Excellent at Supreme Inds., Astral, Finolex Inds., and Kingfa Science, Good at Shaily Engineer, Time Technoplast, and Apollo Pipes, and Below Average at Jain Irrigation.<BR><BR>Return Snapshot: Shaily Engineer has the highest 1-year return at 199.86%, while Jain Irrigation has the lowest at -9.75%. Shaily Engineer's return significantly outperforms Jain Irrigation. Additionally, the peers with negative six-month returns include Supreme Inds., Finolex Inds., Time Technoplast, Prince Pipes, and Jai Corp.

View full answer

Who are the top shareholders of the Shaily Engineer.?

17-Jul-2025

The top shareholders of Shaily Engineer include promoters led by Tilottama Sanghvi with 14.01%, mutual funds holding 11.64%, foreign institutional investors at 7.39%, and individual investors owning 23.43%. The largest public shareholder is Motilal Oswal Small Cap Fund with 9.27%.

The top shareholders of Shaily Engineer include a mix of promoters, mutual funds, and individual investors. The majority shareholders are the promoters, with Tilottama Sanghvi holding the highest stake at 14.01%. Mutual funds collectively hold 11.64% through 8 different schemes, while foreign institutional investors (FIIs) account for 7.39% with 66 FIIs involved. The highest public shareholder is Motilal Oswal Small Cap Fund, which holds 9.27%. Additionally, individual investors own 23.43% of the company.

View full answer

Is Shaily Engineer. technically bullish or bearish?

06-Nov-2025

As of November 4, 2025, the technical trend for Shaily Engineer is bullish, supported by strong MACD and Bollinger Bands indicators, despite a mildly bearish KST signal and some consolidation in Dow Theory and OBV.

As of 4 November 2025, the technical trend has changed from mildly bullish to bullish. The current stance is bullish with strong indicators supporting this view. The MACD is bullish on both the weekly and monthly time frames, and Bollinger Bands also indicate a bullish trend on both time frames. Daily moving averages confirm a bullish outlook. However, the KST shows a mildly bearish signal on the monthly, which slightly tempers the overall strength. The absence of trends in Dow Theory and OBV on both weekly and monthly time frames suggests some consolidation. Overall, the bullish indicators outweigh the bearish signals, indicating a strong bullish stance for Shaily Engineer.

View full answer

How has been the historical performance of Shaily Engineer.?

12-Nov-2025

Shaily Engineer has shown consistent growth in net sales and profitability over the past four years, with net sales rising from 567.71 Cr in Mar'22 to 786.80 Cr in Mar'25, and profit after tax increasing from 35.27 Cr to 93.12 Cr. The company's total assets also grew significantly, from 677.20 Cr to 932.62 Cr during the same period.

Answer:<BR>The historical performance of Shaily Engineer shows a consistent growth trajectory in net sales and profitability over the past four years.<BR><BR>Breakdown:<BR>Shaily Engineer's net sales increased from 567.71 Cr in Mar'22 to 786.80 Cr in Mar'25, demonstrating a strong upward trend. Total operating income followed a similar pattern, rising from 567.71 Cr in Mar'22 to 786.80 Cr in Mar'25. The company's total expenditure also grew, reaching 610.74 Cr in Mar'25, up from 486.52 Cr in Mar'22. Operating profit (PBDIT) saw significant growth, climbing from 90.02 Cr in Mar'22 to 178.38 Cr in Mar'25, indicating improved operational efficiency. Profit before tax rose from 46.53 Cr in Mar'22 to 119.28 Cr in Mar'25, while profit after tax increased from 35.27 Cr to 93.12 Cr in the same period. The earnings per share (EPS) also improved, moving from 38.46 in Mar'22 to 20.27 in Mar'25. On the balance sheet, total assets grew from 677.20 Cr in Mar'22 to 932.62 Cr in Mar'25, while total liabilities increased from 677.20 Cr to 932.62 Cr. Cash flow from operating activities improved from 55.00 Cr in Mar'22 to 110.00 Cr in Mar'25, although net cash flow showed a slight outflow of 3.00 Cr in Mar'25 compared to an inflow of 34.00 Cr in Mar'22. Overall, Shaily Engineer has demonstrated robust growth in sales and profitability, alongside a solid increase in assets.

View full answer

How has been the historical performance of Shaily Engineer.?

12-Nov-2025

Shaily Engineer has shown consistent growth over the past four years, with net sales increasing from 567.71 Cr in Mar'22 to 786.80 Cr in Mar'25, and profit after tax rising from 35.27 Cr to 93.12 Cr, indicating improved profitability and operational efficiency. Total assets also grew significantly, reflecting a balanced growth in both assets and liabilities.

Answer:<BR>The historical performance of Shaily Engineer shows a consistent growth trend in net sales and profitability over the past four years.<BR><BR>Breakdown:<BR>Shaily Engineer's net sales increased from 567.71 Cr in Mar'22 to 786.80 Cr in Mar'25, reflecting a strong upward trajectory. Total operating income followed a similar pattern, rising from 567.71 Cr to 786.80 Cr during the same period. The company's total expenditure also grew, from 486.52 Cr in Mar'22 to 610.74 Cr in Mar'25, primarily driven by rising raw material costs and employee expenses. Operating profit (PBDIT) saw a significant increase, climbing from 90.02 Cr in Mar'22 to 178.38 Cr in Mar'25, indicating improved operational efficiency. Profit before tax rose from 46.53 Cr to 119.28 Cr, while profit after tax increased from 35.27 Cr to 93.12 Cr, showcasing enhanced profitability. The earnings per share (EPS) also improved from 38.46 in Mar'22 to 20.27 in Mar'25, despite a drop in the face value of shares. On the balance sheet, total assets grew from 677.20 Cr to 932.62 Cr, with total liabilities increasing from 677.20 Cr to 932.62 Cr as well, indicating a balanced growth in both assets and liabilities. Cash flow from operating activities improved from 55.00 Cr in Mar'22 to 110.00 Cr in Mar'25, although the net cash flow showed a slight outflow in the latest year. Overall, Shaily Engineer has demonstrated robust growth in sales, profits, and asset base over the past four years.

View full answer

When is the next results date for Shaily Engineering Plastics Ltd?

15-May-2026

The next results date for Shaily Engineering Plastics Ltd is 19 May 2026.

The next results date for Shaily Engineering Plastics Ltd is scheduled for 19 May 2026.

View full answer

Are Shaily Engineering Plastics Ltd latest results good or bad?

20-May-2026

Shaily Engineering Plastics Ltd's latest Q4 FY26 results are positive, with a net profit increase of 40.47% year-on-year and net sales growth of 8.72%. Despite a slight sequential sales decline, the company shows strong operational efficiency and improved margins, positioning it well for future growth.

Shaily Engineering Plastics Ltd's latest results for Q4 FY26 can be considered quite positive overall. The company reported a net profit of ₹40.16 crores, which marks a significant year-on-year increase of 40.47%. Additionally, net sales reached ₹236.82 crores, reflecting an 8.72% growth compared to the same quarter last year.<BR><BR>While there was a sequential decline in net sales of 5.46% from the previous quarter, this appears to be more of a tactical adjustment rather than an indication of underlying weakness, especially given the strong year-on-year growth. The operating margin improved to 27.71%, up 271 basis points year-on-year, and the profit after tax (PAT) margin also expanded to 16.96%, which is an increase of 384 basis points from the previous year.<BR><BR>The overall financial performance indicates robust operational efficiency and strong pricing power in its niche markets, particularly in the pharmaceutical and medical device sectors. Despite the sequential sales dip, the company's ability to improve margins and profitability suggests a solid operational foundation. <BR><BR>In terms of stock performance, Shaily Engineering Plastics has shown remarkable resilience, trading close to its 52-week high, and has delivered impressive returns over the past year, outperforming broader market indices. <BR><BR>In summary, the latest results reflect a strong performance with significant growth in profitability and margins, despite a minor sequential sales decline. This positions the company favorably for future growth, particularly in its specialized market segments.

View full answer

Should I buy, sell or hold Shaily Engineering Plastics Ltd?

20-May-2026

Why is Shaily Engineering Plastics Ltd falling/rising?

24-May-2026

As of 24-May, Shaily Engineering Plastics Ltd's stock price has fallen to Rs 2,689.55, marking a 2.28% decrease after two days of gains. Despite strong long-term performance, current market conditions indicate a short-term decline and reduced investor participation.

As of 24-May, Shaily Engineering Plastics Ltd's stock price is falling, currently at Rs 2,689.55, which reflects a decrease of Rs 62.8 or 2.28%. This decline comes after two consecutive days of gains, indicating a trend reversal. The stock has underperformed its sector by 4.07% today, and it reached an intraday high of Rs 2,822.6 before dropping to a low of Rs 2,680.<BR><BR>Additionally, there has been a notable decrease in investor participation, with delivery volume falling by 26.89% compared to the 5-day average. Although the stock has shown strong performance over longer periods, such as a 49.33% return over the past year and a staggering 903.49% over three years, the current market conditions and recent performance suggest a short-term decline. The stock is still trading above its longer-term moving averages, but it is below the 5-day moving average, further indicating a potential shift in momentum.

View full answer
iScoreScore
Click here to find our call on this stock
Strong Sell
Sell
Hold
Buy
Strong Buy

Dashboard

1

High Management Efficiency with a high ROCE of 17.08%

 
2

Strong ability to service debt as the company has a low Debt to EBITDA ratio of 0.63 times

 
3

Healthy long term growth as Operating profit has grown by an annual rate 57.83%

 
4

The company has declared Positive results for the last 10 consecutive quarters

5

High Institutional Holdings at 27.34%

6

Consistent Returns over the last 3 years

stock-summaryMojo Parameters

Mojo Parameters

Loading Valuation Snapshot...

Stock DNA

stock-summary
Industry

Plastic Products - Industrial

stock-summary
Market cap

INR 12,588 Cr (Small Cap)

stock-summary
P/E

73.00

stock-summary
Industry P/E

36

stock-summary
Dividend Yield

0.07%

stock-summary
Debt Equity

0.21

stock-summary
Return on Equity

23.71%

stock-summary
Price to Book

17.23

Revenue and Profits:
Net Sales:
237 Cr
(Quarterly Results - Mar 2026)
Net Profit:
40 Cr
stock-summaryTotal Returns
Total Returns (Price + Dividend) stock-summary
Dividend Yield (0.07%)
TimePeriod
Price Return
Dividend Return
Total Return
3 Months
40.97%
0%
40.97%
6 Months
8.3%
0%
8.3%
1 Year
51.48%
0.10%
51.58%
2 Years
308.52%
0.50%
309.02%
3 Years
952.78%
1.15%
953.93%
4 Years
673.86%
0.83%
674.69%
5 Years
0%
0%
0.0%

Latest dividend: 2 per share ex-dividend date: Sep-19-2025

Risk Adjusted Returns v/s stock-summary
Returns Beta
Icon
Beta has not been calculated since enough price history is not available
stock-summaryNews & Corporate Actions

News

Shaily Engineering Plastics Falls 2.93%: 4 Key Factors Driving the Weekly Move

Key Events This Week

May 18: Upgraded to Buy on Strong Fundamentals and Technicals

May 18: Technical Momentum Shifts to Bullish Amid Strong Returns

May 20: Hits Intraday High with 7.02% Surge

May 20: Q4 FY26 Results Confirm Stellar Growth Trajectory

Announcements stock-summary

Icon
No announcement available

Corporate Actions stock-summary

stock-summary
BOARD MEETING

No Upcoming Board Meetings

stock-summary
DIVIDEND

Shaily Engineering Plastics Ltd has declared 100% dividend, ex-date: 19 Sep 25

stock-summary
SPLITS

Shaily Engineering Plastics Ltd has announced 2:10 stock split, ex-date: 23 Nov 23

stock-summary
BONUS

No Bonus history available

stock-summary
RIGHTS

No Rights history available

stock-summaryKey Factors

Quality key factors stock-summary

Factor
Value
Sales Growth (5y)
17.73%
EBIT Growth (5y)
57.83%
EBIT to Interest (avg)
7.56
Debt to EBITDA (avg)
2.67
Net Debt to Equity (avg)
0.21
Sales to Capital Employed (avg)
0.94
Tax Ratio
23.68%
Dividend Payout Ratio
9.87%
Pledged Shares
0
Institutional Holding
27.34%
ROCE (avg)
14.22%
ROE (avg)
15.49%

Valuation key factors

Factor
Value
P/E Ratio
73
Industry P/E
36
Price to Book Value
17.23
EV to EBIT
54.27
EV to EBITDA
44.72
EV to Capital Employed
14.39
EV to Sales
12.62
PEG Ratio
0.88
Dividend Yield
0.07%
ROCE (Latest)
26.51%
ROE (Latest)
23.71%

Technicals key factors

Indicator
Weekly
Monthly
MACD
Bullish
Mildly Bearish
RSI
No Signal
No Signal
Bollinger Bands
Mildly Bullish
Bullish
Moving Averages
Bullish (Daily)
KST
Bullish
Mildly Bearish
Dow Theory
Bullish
Bullish
OBV
Bullish
Bullish
stock-summary Technical Indicator Scale: Bearish, Mildly Bearish, Sideways, Mildly Bullish, Bullish  Turned 
stock-summaryShareholding
Shareholding Snapshot : Mar 2026stock-summary
Shareholding Compare (%holding) stock-summary
Majority shareholders

Promoters

Pledged Promoter Holdings

None

Mutual Funds

Held by 11 Schemes (8.73%)

FIIs

Held by 122 FIIs (16.74%)

Promoter with highest holding

Tilottama Sanghvi (14.01%)

Highest Public shareholder

Motilal Oswal Small Cap Fund (9.11%)

Individual Investors Holdings

23.28%

stock-summaryFinancial
[
  {
    "link": "quarterly",
    "btn_text": "All Quarterly Results",
    "header": "Quarterly Results Snapshot (Consolidated) - Mar'26 - QoQ",
    "rhs": [
      {
        "prefix": "Net Sales ",
        "suffix": "QoQ Growth in quarter ended Mar 2026 is -5.46% vs -2.40% in Dec 2025",
        "dir": -1
      },
      {
        "prefix": "Consolidated Net Profit ",
        "suffix": "QoQ Growth in quarter ended Mar 2026 is 7.44% vs -27.06% in Dec 2025",
        "dir": 1
      }
    ],
    "table": {
      "header": [
        "Mar'26",
        "Dec'25",
        "Change(%)"
      ],
      "body": [
        {
          "field": "Net Sales",
          "val1": "236.82",
          "val2": "250.50",
          "chgp": "-5.46%",
          "chgp_class": "negative"
        },
        {
          "field": "Operating Profit (PBDIT) excl Other Income",
          "val1": "65.62",
          "val2": "66.34",
          "chgp": "-1.09%",
          "chgp_class": "negative"
        },
        {
          "field": "Interest",
          "val1": "3.70",
          "val2": "4.38",
          "chgp": "-15.53%",
          "chgp_class": "positive"
        },
        {
          "field": "Exceptional Items",
          "val1": "0.00",
          "val2": "0.00",
          "chgp": "",
          "chgp_class": "neutral"
        },
        {
          "field": "Consolidate Net Profit",
          "val1": "40.16",
          "val2": "37.38",
          "chgp": "7.44%",
          "chgp_class": "positive"
        },
        {
          "field": "Operating Profit Margin (Excl OI)",
          "val1": "27.71%",
          "val2": "26.48%",
          "chgp": "1.23%",
          "chgp_class": "positive"
        }
      ]
    }
  },
  {
    "link": "half-yearly",
    "btn_text": "All Half Yearly Results",
    "header": "Half Yearly Results Snapshot (Consolidated) - Sep'25",
    "rhs": [
      {
        "prefix": "Net Sales ",
        "suffix": " Growth in half year ended Sep 2025 is 35.53% vs 17.95% in Sep 2024",
        "dir": 1
      },
      {
        "prefix": "Consolidated Net Profit ",
        "suffix": " Growth in half year ended Sep 2025 is 134.86% vs 67.86% in Sep 2024",
        "dir": 1
      }
    ],
    "table": {
      "header": [
        "Sep'25",
        "Sep'24",
        "Change(%)"
      ],
      "body": [
        {
          "field": "Net Sales",
          "val1": "503.35",
          "val2": "371.39",
          "chgp": "35.53%",
          "chgp_class": "positive"
        },
        {
          "field": "Operating Profit (PBDIT) excl Other Income",
          "val1": "147.64",
          "val2": "75.69",
          "chgp": "95.06%",
          "chgp_class": "positive"
        },
        {
          "field": "Interest",
          "val1": "7.79",
          "val2": "8.89",
          "chgp": "-12.37%",
          "chgp_class": "positive"
        },
        {
          "field": "Exceptional Items",
          "val1": "0.00",
          "val2": "0.00",
          "chgp": "",
          "chgp_class": "neutral"
        },
        {
          "field": "Consolidate Net Profit",
          "val1": "92.37",
          "val2": "39.33",
          "chgp": "134.86%",
          "chgp_class": "positive"
        },
        {
          "field": "Operating Profit Margin (Excl OI)",
          "val1": "29.33%",
          "val2": "20.38%",
          "chgp": "8.95%",
          "chgp_class": "positive"
        }
      ]
    }
  },
  {
    "link": "nine-monthly",
    "btn_text": "All Nine Monthly Results",
    "header": "Nine Monthly Results Snapshot (Consolidated) - Dec'25",
    "rhs": [
      {
        "prefix": "Net Sales ",
        "suffix": "YoY Growth in nine months ended Dec 2025 is 32.49% vs 20.21% in Dec 2024",
        "dir": 1
      },
      {
        "prefix": "Consolidated Net Profit ",
        "suffix": "YoY Growth in nine months ended Dec 2025 is 101.07% vs 70.04% in Dec 2024",
        "dir": 1
      }
    ],
    "table": {
      "header": [
        "Dec'25",
        "Dec'24",
        "Change(%)"
      ],
      "body": [
        {
          "field": "Net Sales",
          "val1": "753.85",
          "val2": "568.97",
          "chgp": "32.49%",
          "chgp_class": "positive"
        },
        {
          "field": "Operating Profit (PBDIT) excl Other Income",
          "val1": "213.98",
          "val2": "121.56",
          "chgp": "76.03%",
          "chgp_class": "positive"
        },
        {
          "field": "Interest",
          "val1": "12.17",
          "val2": "13.03",
          "chgp": "-6.60%",
          "chgp_class": "positive"
        },
        {
          "field": "Exceptional Items",
          "val1": "0.00",
          "val2": "0.00",
          "chgp": "",
          "chgp_class": "neutral"
        },
        {
          "field": "Consolidate Net Profit",
          "val1": "129.75",
          "val2": "64.53",
          "chgp": "101.07%",
          "chgp_class": "positive"
        },
        {
          "field": "Operating Profit Margin (Excl OI)",
          "val1": "28.38%",
          "val2": "21.36%",
          "chgp": "7.02%",
          "chgp_class": "positive"
        }
      ]
    }
  },
  {
    "link": "annual",
    "btn_text": "All Annual Results",
    "header": "Annual Results Snapshot (Consolidated) - Mar'26",
    "rhs": [
      {
        "prefix": "Net Sales ",
        "suffix": "YoY Growth in year ended Mar 2026 is 25.91% vs 22.20% in Mar 2025",
        "dir": 1
      },
      {
        "prefix": "Consolidated Net Profit ",
        "suffix": "YoY Growth in year ended Mar 2026 is 82.46% vs 62.54% in Mar 2025",
        "dir": 1
      }
    ],
    "table": {
      "header": [
        "Mar'26",
        "Mar'25",
        "Change(%)"
      ],
      "body": [
        {
          "field": "Net Sales",
          "val1": "990.67",
          "val2": "786.80",
          "chgp": "25.91%",
          "chgp_class": "positive"
        },
        {
          "field": "Operating Profit (PBDIT) excl Other Income",
          "val1": "279.92",
          "val2": "176.06",
          "chgp": "58.99%",
          "chgp_class": "positive"
        },
        {
          "field": "Interest",
          "val1": "15.87",
          "val2": "16.95",
          "chgp": "-6.37%",
          "chgp_class": "positive"
        },
        {
          "field": "Exceptional Items",
          "val1": "0.00",
          "val2": "0.00",
          "chgp": "",
          "chgp_class": "neutral"
        },
        {
          "field": "Consolidate Net Profit",
          "val1": "169.91",
          "val2": "93.12",
          "chgp": "82.46%",
          "chgp_class": "positive"
        },
        {
          "field": "Operating Profit Margin (Excl OI)",
          "val1": "28.26%",
          "val2": "22.38%",
          "chgp": "5.88%",
          "chgp_class": "positive"
        }
      ]
    }
  }
]

Quarterly Results Snapshot (Consolidated) - Mar'26 - QoQstock-summary

Mar'26
Dec'25
Change(%)
Net Sales
236.82
250.50
-5.46%
Operating Profit (PBDIT) excl Other Income
65.62
66.34
-1.09%
Interest
3.70
4.38
-15.53%
Exceptional Items
0.00
0.00
Consolidate Net Profit
40.16
37.38
7.44%
Operating Profit Margin (Excl OI)
27.71%
26.48%
1.23%
Values in Rs Cr.
Direction Arrows
Net Sales

QoQ Growth in quarter ended Mar 2026 is -5.46% vs -2.40% in Dec 2025

Direction Arrows
Consolidated Net Profit

QoQ Growth in quarter ended Mar 2026 is 7.44% vs -27.06% in Dec 2025

Half Yearly Results Snapshot (Consolidated) - Sep'25stock-summary

Sep'25
Sep'24
Change(%)
Net Sales
503.35
371.39
35.53%
Operating Profit (PBDIT) excl Other Income
147.64
75.69
95.06%
Interest
7.79
8.89
-12.37%
Exceptional Items
0.00
0.00
Consolidate Net Profit
92.37
39.33
134.86%
Operating Profit Margin (Excl OI)
29.33%
20.38%
8.95%
Values in Rs Cr.
Direction Arrows
Net Sales

Growth in half year ended Sep 2025 is 35.53% vs 17.95% in Sep 2024

Direction Arrows
Consolidated Net Profit

Growth in half year ended Sep 2025 is 134.86% vs 67.86% in Sep 2024

Nine Monthly Results Snapshot (Consolidated) - Dec'25stock-summary

Dec'25
Dec'24
Change(%)
Net Sales
753.85
568.97
32.49%
Operating Profit (PBDIT) excl Other Income
213.98
121.56
76.03%
Interest
12.17
13.03
-6.60%
Exceptional Items
0.00
0.00
Consolidate Net Profit
129.75
64.53
101.07%
Operating Profit Margin (Excl OI)
28.38%
21.36%
7.02%
Values in Rs Cr.
Direction Arrows
Net Sales

YoY Growth in nine months ended Dec 2025 is 32.49% vs 20.21% in Dec 2024

Direction Arrows
Consolidated Net Profit

YoY Growth in nine months ended Dec 2025 is 101.07% vs 70.04% in Dec 2024

Annual Results Snapshot (Consolidated) - Mar'26stock-summary

Mar'26
Mar'25
Change(%)
Net Sales
990.67
786.80
25.91%
Operating Profit (PBDIT) excl Other Income
279.92
176.06
58.99%
Interest
15.87
16.95
-6.37%
Exceptional Items
0.00
0.00
Consolidate Net Profit
169.91
93.12
82.46%
Operating Profit Margin (Excl OI)
28.26%
22.38%
5.88%
Values in Rs Cr.
Direction Arrows
Net Sales

YoY Growth in year ended Mar 2026 is 25.91% vs 22.20% in Mar 2025

Direction Arrows
Consolidated Net Profit

YoY Growth in year ended Mar 2026 is 82.46% vs 62.54% in Mar 2025

stock-summaryCompany CV
About Shaily Engineering Plastics Ltd stock-summary
stock-summary
Shaily Engineering Plastics Ltd
Small Cap
Plastic Products - Industrial
Shaily Engineering Plastics Limited was established in 1987 by Mike Sanghvi, with 2 injection molding machines at Halol, Gujarat (Western most part of India). Shaily was setup by Mike Sanghvi to fulfill a gap in the market by providing precision engineering plastic molded components.
Company Coordinates stock-summary
Company Details
Survey 364/366, Post Rania Taluka Savil Vadodara Gujarat : 391780
stock-summary
Tel: 91-2667-244307/348/361
stock-summary
investors@shaily.com
Registrar Details
Bigshare Services Pvt Ltd , E-2 , Ansa Industrial Estate, Saki Vihar Road, Saki Naka, Andheri (E), Mumbai