Astral

  • Market Cap: Mid Cap
  • Industry: Plastic Products - Industrial
  • ISIN: INE006I01046
  • NSEID: ASTRAL
  • BSEID: 532830
INR
1,554.60
12.9 (0.84%)
BSENSE

May 25

BSE+NSE Vol: 2.42 lacs

  • Price Points
  • Score
  • Mojo Parameters
  • Total Return
  • News and Corporate Actions
  • Key factors
  • Shareholding
  • Financials
  • CompanyCV
stock-summaryPrice Point
High/Low

1Day

52 Week

Valuation
Technical
Day's Volume

CASH

2.42 lacs (-57.83%) Volume

Shareholding (Mar 2026)

FII

14.50%

Held by 530 FIIs

DII

21.29%

Held by 39 DIIs

Promoter

54.22%

What does Astral do?

06-Jun-2025

Astral Ltd is a leading manufacturer of CPVC and PVC plumbing systems for residential and industrial use, with a market cap of Rs 40,969 Cr and a net profit of 179 Cr as of March 2025. The company has a P/E ratio of 78.00 and a return on equity of 14.48%.

Overview: <BR>Astral Ltd is a leading manufacturer in the Plastic Products - Industrial sector, specializing in Chlorinated Poly Vinyl Chloride (CPVC) and Poly Vinyl Chloride (PVC) plumbing systems for both residential and industrial applications.<BR><BR>History: <BR>Astral Ltd was incorporated in an unspecified year and has established itself as a prominent player in the CPVC and PVC pipe industry. The latest quarterly results reported are for March 2025, showcasing the company's ongoing performance.<BR><BR>Financial Snapshot: <BR>Net Sales: 1,681 Cr (Quarterly Results - Mar 2025) <BR>Net Profit: 179 Cr (Quarterly Results - Mar 2025) <BR>Market Cap: Rs 40,969 Cr (Large Cap)<BR><BR>Key Metrics: <BR>P/E: 78.00 <BR>Industry P/E: 41 <BR>Dividend Yield: 0.25% <BR>Debt-Equity: -0.10 <BR>Return on Equity: 14.48% <BR>Price to Book: 11.23<BR><BR>Contact Details: <BR>Address: Astral House 207/1, B/h Rajpath Club Off SGHighway Ahmedabad Gujarat : 380059 <BR>Tel: 91-079-66212000 <BR>Email: co@astralpipes.com/investor@astralp <BR>Website: http://www.astralltd.com

View full answer

What is the bonus history of the Astral?

06-Jun-2025

Astral's bonus history includes a recent 1:3 bonus issue announced on March 14, 2023, another 1:3 bonus on March 18, 2021, and a 1:4 bonus issued on September 16, 2019, reflecting a consistent strategy of rewarding shareholders.

Astral has a notable bonus history. The most recent bonus issue was a 1:3 ratio, which was announced with an ex-date of March 14, 2023. Prior to that, there was another 1:3 bonus issue on March 18, 2021, with a record date of March 19, 2021. Additionally, on September 16, 2019, Astral issued a bonus at a ratio of 1:4. This pattern indicates a consistent approach to rewarding shareholders through bonus issues over the years.

View full answer

Has Astral declared dividend?

06-Jun-2025

Yes, Astral Ltd has declared a 150% dividend, amounting to 1.5 per share, with an ex-date of November 14, 2024. Recent total returns show mixed performance, with significant declines in the short term but strong recovery over the longer term.

Astral Ltd has declared a 150% dividend.<BR><BR>Dividend Details:<BR>- Percentage announced: 150%<BR>- Amount per share: 1.5<BR>- Ex-date: 14 Nov 24<BR><BR>Dividend Yield: 0.25%.<BR><BR>Total Returns by Period:<BR>In the last 6 months, the price return was -17.9%, the dividend return was 0%, resulting in a total return of -17.9%.<BR><BR>Over the past year, the price return was -29.58%, the dividend return was 0.17%, leading to a total return of -29.41%.<BR><BR>In the 2-year period, the price return was -20.75%, the dividend return was 0.38%, which resulted in a total return of -20.37%.<BR><BR>For the 3-year period, the price return was 17.73%, the dividend return was 0.85%, culminating in a total return of 18.58%.<BR><BR>In the 4-year period, the price return was 6.41%, the dividend return was 0.87%, resulting in a total return of 7.28%.<BR><BR>Finally, over the last 5 years, the price return was 194.09%, the dividend return was 2.49%, leading to a total return of 196.58%.<BR><BR>Overall, while Astral Ltd has declared a substantial dividend, the recent total returns indicate a mixed performance, with significant declines in shorter periods but a strong recovery over the longer term.

View full answer

Who are the peers of the Astral?

03-Jun-2025

Astral's peers include Supreme Inds., Finolex Inds., Garware Hi Tech, Shaily Engineer, Time Technoplast, Kingfa Science, Jain Irrigation, Prince Pipes, Apollo Pipes, and Jai Corp. Shaily Engineer leads in 1-year returns at 199.86%, while Astral's return is -30.49%, better than Prince Pipes' -46.97%.

Peers: The peers of Astral are Supreme Inds., Finolex Inds., Garware Hi Tech, Shaily Engineer., Time Technoplast, Kingfa Science, Jain Irrigation, Prince Pipes, Apollo Pipes, and Jai Corp.<BR><BR>Quality Snapshot: Excellent management risk is observed at Supreme Inds. and Kingfa Science, while Good management risk is found at Astral, Finolex Inds., Shaily Engineer., Time Technoplast, and Prince Pipes. Average management risk is noted at Garware Hi Tech, while Jain Irrigation and Jai Corp exhibit Below Average management risk. In terms of Growth, Excellent growth is seen at Shaily Engineer. and Kingfa Science, while Good growth is observed at Astral, Finolex Inds., and the rest. Below Average growth is noted at Finolex Inds., Time Technoplast, and Prince Pipes, while Jain Irrigation shows Good growth but has a Below Average capital structure.<BR><BR>Return Snapshot: The peer with the highest 1-year return is Shaily Engineer. at 199.86%, while the lowest is Prince Pipes at -46.97%. Astral's 1-year return of -30.49% is better than Prince Pipes but worse than Shaily Engineer. Additionally, several peers, including Supreme Inds., Finolex Inds., and Jain Irrigation, have negative six-month returns.

View full answer

Who are in the management team of Astral?

16-Jul-2025

As of March 2023, the management team of Astral includes Sandeep P Engineer (Chairman & Managing Director), Jagruti S Engineer, Girish B Joshi, Kairav Sandeep Engineer, Hiranand Asandas Savlani (all Whole-time Directors), along with Manan Bhavsar (Company Secretary), and several Independent Directors including Kaushal Nakrani, Viral Jhaveri, C K Gopal, Chetas Desai, and Dhinal A. Shah. This team oversees the company's strategic direction and operations.

As of March 2023, the management team of Astral includes the following individuals:<BR><BR>1. Sandeep P Engineer - Chairman & Managing Director<BR>2. Jagruti S Engineer - Whole-time Director<BR>3. Girish B Joshi - Whole-time Director<BR>4. Kairav Sandeep Engineer - Whole-time Director<BR>5. HIRANAND ASANDAS SAVLANI - Whole-time Director<BR>6. Manan Bhavsar - Company Secretary & Compliance Officer<BR>7. Kaushal Dakshesh Nakrani - Independent Director<BR>8. Viral Jhaveri - Independent Director<BR>9. C K Gopal - Independent Director<BR>10. CHETAS GULABBHAI DESAI - Independent Director<BR>11. Dhinal A. Shah - Independent Director<BR><BR>This team is responsible for the strategic direction and operational management of the company.

View full answer

Who are the top shareholders of the Astral?

17-Jul-2025

The top shareholders of Astral include Sandeep Pravinbhai Engineer, who holds 31.57%, followed by foreign institutional investors at 20.17%, mutual funds at 8.38%, and the Life Insurance Corporation of India at 2.39%. Individual investors collectively own 9.61% of the company.

The top shareholders of Astral include the promoters, who hold the majority of the shares. The promoter with the highest holding is Sandeep Pravinbhai Engineer, owning 31.57% of the company. Additionally, foreign institutional investors (FIIs) hold 20.17% of the shares, while mutual funds account for 8.38% through 33 schemes. The highest public shareholder is the Life Insurance Corporation of India, which holds 2.39%. Individual investors collectively own 9.61% of the company.

View full answer

How big is Astral?

24-Jul-2025

As of 24th July, Astral Ltd has a market capitalization of 39,238.00 Cr, with recent net sales of 5,832.40 Cr and a net profit of 523.80 Cr. The latest balance sheet shows shareholder's funds of 3,188.10 Cr and total assets of 4,495.80 Cr.

As of 24th July, Astral Ltd has a market capitalization of 39,238.00 Cr, categorizing it as a Large Cap company.<BR><BR>In the latest four quarters, Astral reported Net Sales of 5,832.40 Cr and a Net Profit of 523.80 Cr.<BR><BR>The latest annual period for the balance sheet is March 2024, showing Shareholder's Funds of 3,188.10 Cr and Total Assets of 4,495.80 Cr.

View full answer

How has been the historical performance of Astral?

06-Nov-2025

Astral has shown consistent growth in net sales and profits, with net sales rising from 2,507.30 Cr in March 2019 to 5,832.40 Cr in March 2025, and profit after tax reaching 518.90 Cr in March 2025. The company has also significantly increased its total assets and liabilities during this period.

Answer:<BR>The historical performance of Astral shows a consistent growth trajectory in net sales and profits over the years.<BR><BR>Breakdown:<BR>Astral's net sales have increased from 2,507.30 Cr in March 2019 to 5,832.40 Cr in March 2025, reflecting a strong upward trend. The total operating income has followed a similar pattern, rising to 5,832.40 Cr in March 2025 from 2,507.30 Cr in March 2019. The company's operating profit (PBDIT) has also seen growth, reaching 987.20 Cr in March 2025, up from 400.30 Cr in March 2019. However, profit before tax peaked at 733.70 Cr in March 2024 before slightly declining to 702.50 Cr in March 2025. Profit after tax has shown a steady increase, culminating at 518.90 Cr in March 2025, although it was slightly lower than the previous year's 545.70 Cr. The company's total assets have grown significantly from 2,289.10 Cr in March 2020 to 5,047.80 Cr in March 2025, indicating robust asset accumulation. Total liabilities have also increased, reaching 5,047.80 Cr in March 2025, reflecting the company's expansion. Cash flow from operating activities was 629.00 Cr in March 2025, down from 823.00 Cr in March 2024, while the net cash outflow was minimal at -1.00 Cr in March 2025. Overall, Astral has demonstrated solid growth in sales and profitability, alongside an increase in assets and liabilities.

View full answer

Is Astral technically bullish or bearish?

24-Nov-2025

As of November 21, 2025, the trend is mildly bullish due to positive weekly indicators, but caution is advised due to bearish monthly signals.

As of 21 November 2025, the technical trend has changed from bullish to mildly bullish. The current stance is mildly bullish, driven by the weekly MACD and KST both indicating bullish momentum, while the daily moving averages also reflect a mildly bullish outlook. However, the monthly MACD and KST are bearish, suggesting caution. The RSI shows no signal on the weekly timeframe but is bullish on the monthly, indicating mixed signals. Overall, the strength of the bullish stance is tempered by bearish indicators on the monthly charts.

View full answer

When is the next results date for Astral Ltd?

08-May-2026

The next results date for Astral Ltd is 18 May 2026.

The next results date for Astral Ltd is scheduled for 18 May 2026.

View full answer

Are Astral Ltd latest results good or bad?

19-May-2026

Astral Ltd's Q4 FY26 results are strong, with a net profit of ₹213 crores, up 97.77% QoQ and 18.80% YoY, and revenue of ₹2,088.50 crores, reflecting significant growth. However, the high price-to-earnings ratio of 80x may raise valuation concerns despite the impressive performance.

Astral Ltd's latest results for Q4 FY26 are quite strong, showcasing significant growth in both revenue and net profit. The company reported a net profit of ₹213.00 crores, which is a remarkable increase of 97.77% quarter-on-quarter (QoQ) and 18.80% year-on-year (YoY). Revenue also saw a substantial rise, reaching ₹2,088.50 crores, marking a 35.48% QoQ increase and a 24.21% YoY growth. <BR><BR>Additionally, the operating margin improved to 18.33%, the highest in seven quarters, reflecting effective cost management and operational efficiencies. The net profit margin also expanded to 10.20%, up from 6.99% in the previous quarter.<BR><BR>Overall, these results indicate a strong performance and operational excellence, especially considering the challenges faced earlier in the fiscal year. However, the stock is trading at a high price-to-earnings ratio of 80x, which raises concerns about its valuation in a moderating growth environment. While the quarterly performance is impressive, the elevated valuation could lead to scrutiny from investors.

View full answer

Should I buy, sell or hold Astral Ltd?

21-May-2026

Why is Astral Ltd falling/rising?

24-May-2026

As of 24-May, Astral Ltd's stock price is rising to Rs 1,540.95, driven by strong recent performance, increased investor participation, solid financial health, and institutional backing. The stock has outperformed its sector and shows growing confidence among investors.

As of 24-May, Astral Ltd's stock price is rising, currently at Rs 1,540.95, reflecting an increase of Rs 60.45 or 4.08%. This upward movement can be attributed to several positive factors. Firstly, the stock has outperformed its sector by 2.67% today and has experienced consecutive gains over the last two days, accumulating a total return of 6.99% during this period. Additionally, the stock reached an intraday high of Rs 1,549, marking a rise of 4.63%.<BR><BR>Investor participation has also increased, with a delivery volume of 3.75 lakh shares on May 21, which is 28.68% higher than the five-day average. This suggests growing interest and confidence among investors. Furthermore, Astral Ltd is net-debt free and has demonstrated high management efficiency, evidenced by a return on equity (ROE) of 16.50%. The company reported strong financial results for the quarter ending March 26, with cash and cash equivalents at their highest level of Rs 943.40 crore and net sales reaching Rs 2,088.50 crore.<BR><BR>Moreover, the company has a significant institutional holding of 35.79%, indicating that knowledgeable investors are backing the stock, having increased their stake by 1.04% over the previous quarter. With a market capitalization of Rs 41,478 crore, Astral Ltd is the second-largest company in its sector, contributing 22.58% to the entire industry.<BR><BR>In summary, the combination of strong recent performance, increased investor participation, solid financial health, and backing from institutional investors has contributed to the rise in Astral Ltd's stock price.

View full answer
iScoreScore
Click here to find our call on this stock
Strong Sell
Sell
Hold
Buy
Strong Buy

Dashboard

1

Poor long term growth as Operating profit has grown by an annual rate 7.85% of over the last 5 years

 
2

With ROE of 13.6, it has a Very Expensive valuation with a 10.2 Price to Book Value

stock-summaryMojo Parameters

Mojo Parameters

Loading Valuation Snapshot...

Stock DNA

stock-summary
Industry

Plastic Products - Industrial

stock-summary
Market cap

INR 41,764 Cr (Mid Cap)

stock-summary
P/E

75.00

stock-summary
Industry P/E

36

stock-summary
Dividend Yield

0.24%

stock-summary
Debt Equity

-0.17

stock-summary
Return on Equity

13.64%

stock-summary
Price to Book

10.22

Revenue and Profits:
Net Sales:
2,088 Cr
(Quarterly Results - Mar 2026)
Net Profit:
213 Cr
stock-summaryTotal Returns
Total Returns (Price + Dividend) stock-summary
Dividend Yield (0.24%)
TimePeriod
Price Return
Dividend Return
Total Return
3 Months
-7.64%
0%
-7.64%
6 Months
6.08%
0%
6.08%
1 Year
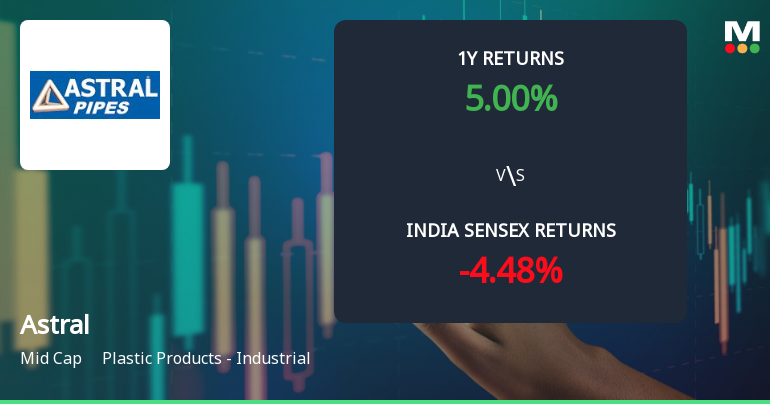
6.72%
0.25%
6.97%
2 Years
-27.66%
0.37%
-27.29%
3 Years
-11.26%
0.57%
-10.69%
4 Years
25.99%
1.14%
27.13%
5 Years
14.16%
1.11%
15.27%

Latest dividend: 1.5 per share ex-dividend date: Nov-11-2025

Risk Adjusted Returns v/s stock-summary
Returns Beta
Icon
Beta has not been calculated since enough price history is not available
stock-summaryNews & Corporate Actions

News

Astral Ltd’s Volatile Week: -0.64% Price Change Amid Mixed Signals and Heavy Put Activity

Key Events This Week

18 May: Week opens at Rs.1,545.90 amid cautious market sentiment

19 May: Intraday low hit at Rs.1,451.3; strong quarterly results announced; surge in put option activity

20 May: Technical momentum shifts to sideways trend with mixed signals

21 May: Downgrade to Sell by MarketsMOJO; technical momentum turns mildly bearish

22 May: Week closes at Rs.1,540.95, down 0.31% on the day

Announcements stock-summary

Astral Poly Technik Limited - Analysts/Institutional Investor Meet/Con. Call Updates

27-Nov-2019 | Source : NSE

Astral Poly Technik Limited has informed the Exchange regarding Analysts/Institutional Investor Meet/Con. Call Updates

Astral Poly Technik Limited - Analysts/Institutional Investor Meet/Con. Call Updates

22-Nov-2019 | Source : NSE

Astral Poly Technik Limited has informed the Exchange regarding Analysts/Institutional Investor Meet/Con. Call Updates

Astral Poly Technik Limited - Analysts/Institutional Investor Meet/Con. Call Updates

21-Nov-2019 | Source : NSE

Astral Poly Technik Limited has informed the Exchange regarding Analysts/Institutional Investor Meet/Con. Call Updates

Corporate Actions stock-summary

stock-summary
BOARD MEETING

No Upcoming Board Meetings

stock-summary
DIVIDEND

Astral Ltd has declared 150% dividend, ex-date: 11 Nov 25

stock-summary
SPLITS

Astral Ltd has announced 1:2 stock split, ex-date: 25 Sep 14

stock-summary
BONUS

Astral Ltd has announced 1:3 bonus issue, ex-date: 14 Mar 23

stock-summary
RIGHTS

No Rights history available

stock-summaryKey Factors

Quality key factors stock-summary

Factor
Value
Sales Growth (5y)
15.64%
EBIT Growth (5y)
7.85%
EBIT to Interest (avg)
23.65
Debt to EBITDA (avg)
0.17
Net Debt to Equity (avg)
-0.17
Sales to Capital Employed (avg)
1.70
Tax Ratio
26.81%
Dividend Payout Ratio
19.26%
Pledged Shares
0
Institutional Holding
35.79%
ROCE (avg)
27.42%
ROE (avg)
16.50%

Valuation key factors

Factor
Value
P/E Ratio
75
Industry P/E
36
Price to Book Value
10.22
EV to EBIT
52.95
EV to EBITDA
38.41
EV to Capital Employed
12.12
EV to Sales
6.21
PEG Ratio
13.33
Dividend Yield
0.24%
ROCE (Latest)
22.89%
ROE (Latest)
13.63%

Technicals key factors

Indicator
Weekly
Monthly
MACD
Mildly Bearish
Mildly Bullish
RSI
No Signal
No Signal
Bollinger Bands
Bearish
Bullish
Moving Averages
Mildly Bullish (Daily)
KST
Mildly Bearish
Mildly Bullish
Dow Theory
Mildly Bearish
Mildly Bearish
OBV
Mildly Bearish
Mildly Bearish
stock-summary Technical Indicator Scale: Bearish, Mildly Bearish, Sideways, Mildly Bullish, Bullish  Turned 
stock-summaryShareholding
Shareholding Snapshot : Mar 2026stock-summary
Shareholding Compare (%holding) stock-summary
Majority shareholders

Promoters

Pledged Promoter Holdings

None

Mutual Funds

Held by 30 Schemes (8.67%)

FIIs

Held by 530 FIIs (14.5%)

Promoter with highest holding

Sandeep Pravinbhai Engineer (31.57%)

Highest Public shareholder

Life Insurance Corporation Of India - Ulif004200910licend+grw512 (6.79%)

Individual Investors Holdings

8.36%

stock-summaryFinancial
[
  {
    "link": "quarterly",
    "btn_text": "All Quarterly Results",
    "header": "Quarterly Results Snapshot (Consolidated) - Mar'26 - YoY",
    "rhs": [
      {
        "prefix": "Net Sales ",
        "suffix": "YoY Growth in quarter ended Mar 2026 is 24.21% vs 3.46% in Mar 2025",
        "dir": 1
      },
      {
        "prefix": "Consolidated Net Profit ",
        "suffix": "YoY Growth in quarter ended Mar 2026 is 18.80% vs -1.27% in Mar 2025",
        "dir": 1
      }
    ],
    "table": {
      "header": [
        "Mar'26",
        "Mar'25",
        "Change(%)"
      ],
      "body": [
        {
          "field": "Net Sales",
          "val1": "2,088.50",
          "val2": "1,681.40",
          "chgp": "24.21%",
          "chgp_class": "positive"
        },
        {
          "field": "Operating Profit (PBDIT) excl Other Income",
          "val1": "382.90",
          "val2": "301.90",
          "chgp": "26.83%",
          "chgp_class": "positive"
        },
        {
          "field": "Interest",
          "val1": "23.50",
          "val2": "9.60",
          "chgp": "144.79%",
          "chgp_class": "negative"
        },
        {
          "field": "Exceptional Items",
          "val1": "-6.10",
          "val2": "0.00",
          "chgp": "",
          "chgp_class": "neutral"
        },
        {
          "field": "Consolidate Net Profit",
          "val1": "213.00",
          "val2": "179.30",
          "chgp": "18.80%",
          "chgp_class": "positive"
        },
        {
          "field": "Operating Profit Margin (Excl OI)",
          "val1": "18.33%",
          "val2": "17.96%",
          "chgp": "0.37%",
          "chgp_class": "positive"
        }
      ]
    }
  },
  {
    "link": "half-yearly",
    "btn_text": "All Half Yearly Results",
    "header": "Half Yearly Results Snapshot (Consolidated) - Sep'25",
    "rhs": [
      {
        "prefix": "Net Sales ",
        "suffix": " Growth in half year ended Sep 2025 is 6.70% vs 4.08% in Sep 2024",
        "dir": 1
      },
      {
        "prefix": "Consolidated Net Profit ",
        "suffix": " Growth in half year ended Sep 2025 is -6.29% vs -8.21% in Sep 2024",
        "dir": 1
      }
    ],
    "table": {
      "header": [
        "Sep'25",
        "Sep'24",
        "Change(%)"
      ],
      "body": [
        {
          "field": "Net Sales",
          "val1": "2,938.60",
          "val2": "2,754.00",
          "chgp": "6.70%",
          "chgp_class": "positive"
        },
        {
          "field": "Operating Profit (PBDIT) excl Other Income",
          "val1": "441.70",
          "val2": "424.50",
          "chgp": "4.05%",
          "chgp_class": "positive"
        },
        {
          "field": "Interest",
          "val1": "28.30",
          "val2": "17.80",
          "chgp": "58.99%",
          "chgp_class": "negative"
        },
        {
          "field": "Exceptional Items",
          "val1": "0.00",
          "val2": "0.00",
          "chgp": "",
          "chgp_class": "neutral"
        },
        {
          "field": "Consolidate Net Profit",
          "val1": "215.90",
          "val2": "230.40",
          "chgp": "-6.29%",
          "chgp_class": "negative"
        },
        {
          "field": "Operating Profit Margin (Excl OI)",
          "val1": "15.03%",
          "val2": "15.41%",
          "chgp": "-0.38%",
          "chgp_class": "negative"
        }
      ]
    }
  },
  {
    "link": "nine-monthly",
    "btn_text": "All Nine Monthly Results",
    "header": "Nine Monthly Results Snapshot (Consolidated) - Dec'25",
    "rhs": [
      {
        "prefix": "Net Sales ",
        "suffix": "YoY Growth in nine months ended Dec 2025 is 7.93% vs 3.35% in Dec 2024",
        "dir": 1
      },
      {
        "prefix": "Consolidated Net Profit ",
        "suffix": "YoY Growth in nine months ended Dec 2025 is -6.07% vs -5.49% in Dec 2024",
        "dir": -1
      }
    ],
    "table": {
      "header": [
        "Dec'25",
        "Dec'24",
        "Change(%)"
      ],
      "body": [
        {
          "field": "Net Sales",
          "val1": "4,480.10",
          "val2": "4,151.00",
          "chgp": "7.93%",
          "chgp_class": "positive"
        },
        {
          "field": "Operating Profit (PBDIT) excl Other Income",
          "val1": "679.00",
          "val2": "644.00",
          "chgp": "5.43%",
          "chgp_class": "positive"
        },
        {
          "field": "Interest",
          "val1": "40.90",
          "val2": "31.70",
          "chgp": "29.02%",
          "chgp_class": "negative"
        },
        {
          "field": "Exceptional Items",
          "val1": "-16.50",
          "val2": "0.00",
          "chgp": "",
          "chgp_class": "neutral"
        },
        {
          "field": "Consolidate Net Profit",
          "val1": "323.60",
          "val2": "344.50",
          "chgp": "-6.07%",
          "chgp_class": "negative"
        },
        {
          "field": "Operating Profit Margin (Excl OI)",
          "val1": "15.16%",
          "val2": "15.51%",
          "chgp": "-0.35%",
          "chgp_class": "negative"
        }
      ]
    }
  },
  {
    "link": "annual",
    "btn_text": "All Annual Results",
    "header": "Annual Results Snapshot (Consolidated) - Mar'26",
    "rhs": [
      {
        "prefix": "Net Sales ",
        "suffix": "YoY Growth in year ended Mar 2026 is 12.62% vs 3.39% in Mar 2025",
        "dir": 1
      },
      {
        "prefix": "Consolidated Net Profit ",
        "suffix": "YoY Growth in year ended Mar 2026 is 2.08% vs -4.08% in Mar 2025",
        "dir": 1
      }
    ],
    "table": {
      "header": [
        "Mar'26",
        "Mar'25",
        "Change(%)"
      ],
      "body": [
        {
          "field": "Net Sales",
          "val1": "6,568.60",
          "val2": "5,832.40",
          "chgp": "12.62%",
          "chgp_class": "positive"
        },
        {
          "field": "Operating Profit (PBDIT) excl Other Income",
          "val1": "1,061.90",
          "val2": "945.90",
          "chgp": "12.26%",
          "chgp_class": "positive"
        },
        {
          "field": "Interest",
          "val1": "64.40",
          "val2": "41.30",
          "chgp": "55.93%",
          "chgp_class": "negative"
        },
        {
          "field": "Exceptional Items",
          "val1": "-22.60",
          "val2": "0.00",
          "chgp": "",
          "chgp_class": "neutral"
        },
        {
          "field": "Consolidate Net Profit",
          "val1": "534.70",
          "val2": "523.80",
          "chgp": "2.08%",
          "chgp_class": "positive"
        },
        {
          "field": "Operating Profit Margin (Excl OI)",
          "val1": "16.17%",
          "val2": "16.22%",
          "chgp": "-0.05%",
          "chgp_class": "negative"
        }
      ]
    }
  }
]

Quarterly Results Snapshot (Consolidated) - Mar'26 - YoYstock-summary

Mar'26
Mar'25
Change(%)
Net Sales
2,088.50
1,681.40
24.21%
Operating Profit (PBDIT) excl Other Income
382.90
301.90
26.83%
Interest
23.50
9.60
144.79%
Exceptional Items
-6.10
0.00
Consolidate Net Profit
213.00
179.30
18.80%
Operating Profit Margin (Excl OI)
18.33%
17.96%
0.37%
Values in Rs Cr.
Direction Arrows
Net Sales

YoY Growth in quarter ended Mar 2026 is 24.21% vs 3.46% in Mar 2025

Direction Arrows
Consolidated Net Profit

YoY Growth in quarter ended Mar 2026 is 18.80% vs -1.27% in Mar 2025

Half Yearly Results Snapshot (Consolidated) - Sep'25stock-summary

Sep'25
Sep'24
Change(%)
Net Sales
2,938.60
2,754.00
6.70%
Operating Profit (PBDIT) excl Other Income
441.70
424.50
4.05%
Interest
28.30
17.80
58.99%
Exceptional Items
0.00
0.00
Consolidate Net Profit
215.90
230.40
-6.29%
Operating Profit Margin (Excl OI)
15.03%
15.41%
-0.38%
Values in Rs Cr.
Direction Arrows
Net Sales

Growth in half year ended Sep 2025 is 6.70% vs 4.08% in Sep 2024

Direction Arrows
Consolidated Net Profit

Growth in half year ended Sep 2025 is -6.29% vs -8.21% in Sep 2024

Nine Monthly Results Snapshot (Consolidated) - Dec'25stock-summary

Dec'25
Dec'24
Change(%)
Net Sales
4,480.10
4,151.00
7.93%
Operating Profit (PBDIT) excl Other Income
679.00
644.00
5.43%
Interest
40.90
31.70
29.02%
Exceptional Items
-16.50
0.00
Consolidate Net Profit
323.60
344.50
-6.07%
Operating Profit Margin (Excl OI)
15.16%
15.51%
-0.35%
Values in Rs Cr.
Direction Arrows
Net Sales

YoY Growth in nine months ended Dec 2025 is 7.93% vs 3.35% in Dec 2024

Direction Arrows
Consolidated Net Profit

YoY Growth in nine months ended Dec 2025 is -6.07% vs -5.49% in Dec 2024

Annual Results Snapshot (Consolidated) - Mar'26stock-summary

Mar'26
Mar'25
Change(%)
Net Sales
6,568.60
5,832.40
12.62%
Operating Profit (PBDIT) excl Other Income
1,061.90
945.90
12.26%
Interest
64.40
41.30
55.93%
Exceptional Items
-22.60
0.00
Consolidate Net Profit
534.70
523.80
2.08%
Operating Profit Margin (Excl OI)
16.17%
16.22%
-0.05%
Values in Rs Cr.
Direction Arrows
Net Sales

YoY Growth in year ended Mar 2026 is 12.62% vs 3.39% in Mar 2025

Direction Arrows
Consolidated Net Profit

YoY Growth in year ended Mar 2026 is 2.08% vs -4.08% in Mar 2025

stock-summaryCompany CV
About Astral Ltd stock-summary
stock-summary
Astral Ltd
Mid Cap
Plastic Products - Industrial
Astral Limited was erstwhile incorporated as 'Astral Poly Technik Private Limited', on March 25, 1996. The Company's name was changed to Astral Poly Technik Limited vide fresh Certificate of Incorporation dated September 29, 2006. Pursuant to Special Resolution, dated March 9, 2021, the Company approved change of name of the Company from "Astral Poly Technik Limited" to "Astral Limited" on April 12, 2021.
Company Coordinates stock-summary
Company Details
Astral House 207/1, B/h Rajpath Club Off SGHighway Ahmedabad Gujarat : 380059
stock-summary
Tel: 91-079-66212000
stock-summary
co@astralpipes.com/investor@astralp
Registrar Details
Bigshare Services Pvt Ltd , E-2 , Ansa Industrial Estate, Saki Vihar Road, Saki Naka, Andheri (E), Mumbai