Supreme Inds.

  • Market Cap: Mid Cap
  • Industry: Plastic Products - Industrial
  • ISIN: INE195A01028
  • NSEID: SUPREMEIND
  • BSEID: 509930
INR
3,475.00
-33.1 (-0.94%)
BSENSE

Sep 04, 03:30 PM

BSE+NSE Vol: 1.44 lacs

  • Price Points
  • Score
  • Mojo Parameters
  • Total Return
  • News and Corporate Actions
  • Key factors
  • Shareholding
  • Financials
  • CompanyCV
stock-summaryPrice Point
High/Low

1Day

52 Week

Valuation
Technical
Day's Volume

CASH

1.44 lacs (-46.27%) Volume

Shareholding (Jun 2026)

FII

17.08%

Held by 555 FIIs

DII

19.08%

Held by 34 DIIs

Promoter

48.96%

Why is Supreme Industries Ltd falling/rising?

06-Sep-2026

As of 05-Sep, Supreme Industries Ltd's stock price is declining at 3,450.15, down 1.68% and has fallen 5.73% over the last five days. The stock has underperformed significantly over the past year and shows bearish trends, with reduced investor interest and a poor long-term growth outlook.

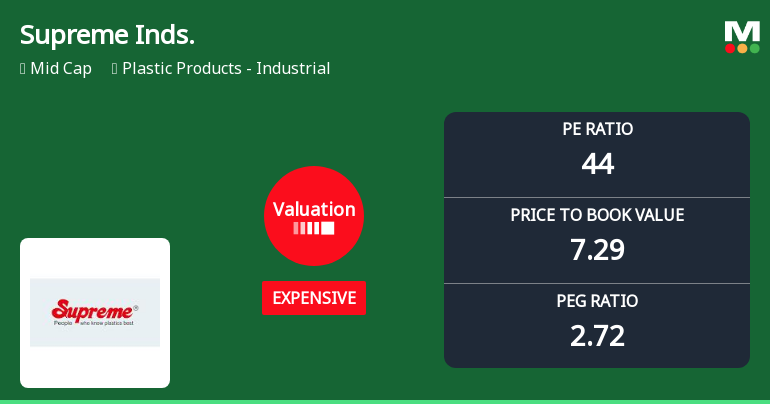
As of 05-Sep, Supreme Industries Ltd is experiencing a decline in its stock price, currently at 3,450.15, which reflects a change of -58.85 (-1.68%). The stock has been underperforming, having fallen consecutively for the last five days, resulting in a total decline of -5.73% over that period. This trend is compounded by the fact that the stock has generated a return of -24.80% over the past year, significantly underperforming the benchmark, which has only declined by -5.21% during the same timeframe.<BR><BR>Additionally, the stock's performance today has underperformed its sector by -1.85%. The moving averages indicate that while the stock is higher than the 50-day moving average, it is lower than the 5-day, 20-day, 100-day, and 200-day moving averages, suggesting a bearish trend. There is also a noticeable decrease in investor participation, with delivery volume falling by -3.05% against the 5-day average, indicating reduced interest from investors.<BR><BR>Despite some positive factors, such as high management efficiency and being net-debt free, the long-term growth outlook appears poor, with operating profit growth at a mere 0.06% over the last five years. The stock's valuation is considered expensive, with a price-to-book value of 7.1, and the PEG ratio of 2.7 suggests that while profits have risen by 16%, the stock has not generated corresponding returns, leading to a lack of investor confidence. Overall, these factors contribute to the ongoing decline in the stock price of Supreme Industries Ltd.

View full answer

Who are in the management team of Supreme Inds.?

01-Sep-2026

The management team of Supreme Inds. includes B L Taparia (Chairman), M P Taparia (Managing Director), S J Taparia, V K Taparia (Executive Directors), and several independent directors, along with the Company Secretary. They are responsible for the company's governance and strategic direction.

The management team of Supreme Inds. includes the following members:<BR><BR>1. **B L Taparia** - Chairman (Non-Executive)<BR>2. **M P Taparia** - Managing Director<BR>3. **S J Taparia** - Executive Director<BR>4. **V K Taparia** - Executive Director<BR>5. **Rajendra J Saboo** - Company Secretary & Compliance Officer<BR>6. **Rajeev M Pandia** - Independent Director<BR>7. **R Kannan** - Independent Director<BR>8. **Sarthak Behuria** - Independent Director<BR>9. **Ameeta Parpia** - Independent Director<BR>10. **Pulak Chandan Prasad** - Director<BR>11. **Vipul Shah** - Independent Director<BR><BR>This team plays a crucial role in the governance and strategic direction of the company.

View full answer

What does Supreme Inds. do?

01-Sep-2026

Supreme Industries Ltd is a leading plastic processor in India, specializing in the Industrial sector. As of June 2026, it reported net sales of ₹2,718 Cr and a net profit of ₹281 Cr, with a market cap of ₹45,902 Cr.

Overview: <BR>Supreme Industries Ltd is one of the largest plastic processors in India, operating in the Plastic Products - Industrial sector within the mid-cap market.<BR><BR>History: <BR>Incorporated on February 17, 1942, in Wadala, Mumbai, the company was initially promoted by the family of Kantilal K Modi and later came under the control of the Taparia family in August 1966 through an outright purchase of shares. The latest quarterly results reported net sales and profit for June 2026.<BR><BR>Financial Snapshot: <BR>Net Sales: 2,718 Cr (Quarterly Results - Jun 2026) <BR>Net Profit: 281 Cr (Quarterly Results - Jun 2026) <BR>Market Cap: INR 45,902 Cr (Mid Cap)<BR><BR>Key Metrics: <BR>P/E: 44.00 <BR>Industry P/E: 34 <BR>Dividend Yield: 0.98% <BR>Debt-Equity: -0.09 <BR>Return on Equity: 15.46% <BR>Price to Book: 7.54<BR><BR>Contact Details: <BR>Address: 612 Raheja Chambers, Nariman Point Mumbai Maharashtra : 400021 <BR>Tel: 91-22-22851656/22820072/59-60 <BR>Email: investor@supreme.co.in <BR>Website: http://www.supreme.co.in

View full answer

Who are the peers of the Supreme Inds.?

01-Sep-2026

Peers of Supreme Inds. include Astral, Garware Hi Tech, Shaily Engineer, Finolex Inds., Time Technoplast, Kingfa Science, Prince Pipes, Apollo Pipes, Jain Irrigation, and Jai Corp. Garware Hi Tech has the highest 1-year return at 165.29%, while Supreme Inds. has a return of -19.45%.

Peers: The peers of Supreme Inds. are Astral, Garware Hi Tech, Shaily Engineer., Finolex Inds., Time Technoplast, Kingfa Science, Prince Pipes, Apollo Pipes, Jain Irrigation, and Jai Corp.<BR><BR>Quality Snapshot: Excellent management risk is observed at Supreme Inds., Astral, Finolex Inds., Shaily Engineer., Time Technoplast, while Average management risk is found at Garware Hi Tech, Kingfa Science, Prince Pipes, Apollo Pipes, and Jai Corp, and the rest have Below Average management risk. Growth is Good for Shaily Engineer. and Time Technoplast, while Below Average growth is seen at Supreme Inds., Astral, Finolex Inds., Garware Hi Tech, Prince Pipes, Apollo Pipes, and Jai Corp, and the rest have Good growth. Excellent capital structure is noted for Supreme Inds., Astral, Garware Hi Tech, Finolex Inds., Kingfa Science, and Prince Pipes, while Good capital structure is seen at Shaily Engineer. and Time Technoplast, and the rest have Below Average capital structure.<BR><BR>Return Snapshot: The peer with the highest 1-year return is Garware Hi Tech at 165.29%, while Jain Irrigation has the lowest at -42.90%. Supreme Inds.' 1-year return of -19.45% is better than Jain Irrigation's but worse than Garware Hi Tech's. Additionally, Finolex Inds., Jain Irrigation, and Jai Corp have negative six-month returns.

View full answer

How big is Supreme Inds.?

01-Sep-2026

As of 31st August, Supreme Industries Ltd has a market capitalization of 45,902.00 Cr, with recent net sales of 11,326.13 Cr and net profit of 1,032.40 Cr over the last four quarters.

As of 31st August, <BR><BR>Market Cap: Supreme Industries Ltd has a market capitalization of 45,902.00 Cr, categorizing it as a Mid Cap company.<BR><BR>Recent Quarterly Performance: The sum of Net Sales for the latest 4 quarters is 11,326.13 Cr, while the sum of Net Profit for the same period is 1,032.40 Cr.<BR><BR>Balance Sheet Snapshot: The reporting period is March 2026, with Shareholder's Funds amounting to 6,169.07 Cr and Total Assets totaling 7,794.89 Cr.

View full answer

Should I buy, sell or hold Supreme Industries Ltd?

01-Sep-2026

Are Supreme Industries Ltd latest results good or bad?

29-Jul-2026

Supreme Industries Ltd's latest results show strong year-on-year growth with a 38.76% increase in net profit and a 4.16% rise in net sales, but there are significant quarter-on-quarter declines of 35.25% in profit and 22.96% in sales, indicating mixed performance and potential short-term challenges.

Supreme Industries Ltd's latest results present a mixed picture. On one hand, the company reported a net profit of ₹280.72 crore for Q1 FY27, which marks a significant year-on-year increase of 38.76%. Additionally, net sales grew by 4.16% year-on-year to ₹2,717.66 crore. The operating margin also improved, reaching 14.64%, up 242 basis points from the previous year.<BR><BR>However, when looking at the quarter-on-quarter performance, there are notable declines. Both net profit and net sales fell by 35.25% and 22.96%, respectively, compared to the previous quarter. This volatility highlights the cyclical nature of the plastic products industry, particularly influenced by seasonal demand fluctuations in construction and infrastructure.<BR><BR>While the year-on-year growth figures are encouraging, the sequential declines raise concerns about the sustainability of this growth and the company's ability to maintain demand in key sectors. Overall, the results indicate strong year-on-year performance but also reveal significant challenges in the short term, suggesting a cautious outlook for investors.

View full answer

When is the next results date for Supreme Industries Ltd?

21-Jul-2026

The next results date for Supreme Industries Ltd is 28 July 2026.

The next results date for Supreme Industries Ltd is scheduled for 28 July 2026.

View full answer

Is Supreme Inds. overvalued or undervalued?

05-Dec-2025

As of December 4, 2025, Supreme Industries is considered very expensive and overvalued with a PE ratio of 49.93 and a PEG ratio of 0.00, indicating that its high valuation may not be justified by growth prospects, especially as it has underperformed the Sensex with a stock return of -29.03% compared to the Sensex's 5.32% return.

As of 4 December 2025, the valuation grade for Supreme Industries has moved from expensive to very expensive, indicating a significant shift in its market perception. The company is currently considered overvalued, with a PE ratio of 49.93, a Price to Book Value of 7.40, and an EV to EBITDA of 31.58. Comparing these metrics with peers, Astral has a PE of 76.01 and an EV to EBITDA of 39.88, while Finolex Industries, which is fairly valued, shows a PE of 21.9 and an EV to EBITDA of 17.91.<BR><BR>The notable outlier in this analysis is the PEG ratio of 0.00, suggesting that the company's growth prospects may not justify its high valuation. Additionally, Supreme Industries has underperformed the Sensex significantly over the past year, with a stock return of -29.03% compared to the Sensex's 5.32% return, reinforcing the notion that the stock may be overpriced in the current market environment.

View full answer

Is Supreme Inds. technically bullish or bearish?

02-Dec-2025

As of December 1, 2025, the technical outlook is firmly bearish, supported by multiple indicators such as bearish MACD and KST readings on both weekly and monthly charts, despite a conflicting bullish RSI signal on the weekly.

As of 1 December 2025, the technical trend has changed from mildly bearish to bearish. The current stance is bearish with a strong indication from multiple indicators. The MACD is bearish on both the weekly and monthly time frames, and Bollinger Bands also reflect a bearish trend in both time frames. Moving averages on the daily chart confirm a bearish outlook. The KST is bearish on both weekly and monthly charts, while the Dow Theory indicates a mildly bearish stance on both time frames. The RSI shows a bullish signal on the weekly, but the overall bearish indicators outweigh this. Given the recent price action, with a decline from the previous close and significant negative returns over multiple periods, the technical outlook remains firmly bearish.

View full answer

Has Supreme Inds. declared dividend?

29-Oct-2025

Yes, Supreme Industries Ltd has declared a dividend of 550%, amounting to ₹24 per share, with an ex-date of November 3, 2025. While short-term returns have been volatile, long-term performance shows significant growth over 3, 4, and 5-year periods.

Supreme Industries Ltd has declared a dividend.<BR><BR>Dividend Details:<BR>- Percentage announced: 550%<BR>- Amount per share: 24<BR>- Ex-date: 03 Nov 25<BR><BR>Dividend Yield: 0.89%<BR><BR>Total Returns by Period:<BR>In the 3-month period, the price return was -10.87%, the dividend return was 0.25%, resulting in a total return of -10.62%.<BR><BR>In the 6-month period, the price return was 7.65%, the dividend return was 1.02%, leading to a total return of 8.67%.<BR><BR>Over the 1-year period, the price return was -11.75%, the dividend return was 0.83%, culminating in a total return of -10.92%.<BR><BR>For the 2-year period, the price return was -8.89%, the dividend return was 1.59%, resulting in a total return of -7.3%.<BR><BR>In the 3-year period, the price return was 88.8%, the dividend return was 3.91%, leading to a total return of 92.71%.<BR><BR>During the 4-year period, the price return was 62.52%, the dividend return was 5.47%, culminating in a total return of 67.99%.<BR><BR>In the 5-year period, the price return was 161.49%, the dividend return was 8.27%, resulting in a total return of 169.76%.<BR><BR>Overall, Supreme Industries Ltd has declared a substantial dividend, and while the short-term returns show some volatility, the long-term performance indicates significant growth, particularly over the 3, 4, and 5-year periods.

View full answer

How has been the historical performance of Supreme Inds.?

28-Oct-2025

Supreme Inds. has shown consistent growth in net sales and profits from Mar'20 to Mar'25, with net sales increasing from 5,511.54 Cr to 10,446.25 Cr. However, rising expenditures have led to fluctuations in operating profit and net income, indicating challenges in maintaining profitability.

Answer:<BR>The historical performance of Supreme Inds. shows a consistent growth trend in net sales and profits over the years, with some fluctuations in margins and expenses.<BR><BR>Breakdown:<BR>Supreme Inds. has demonstrated a steady increase in net sales, rising from 5,511.54 Cr in Mar'20 to 10,446.25 Cr in Mar'25. Total operating income followed a similar trajectory, reaching 10,446.25 Cr in Mar'25, up from 5,511.54 Cr in Mar'20. However, total expenditure also increased significantly, from 4,676.99 Cr in Mar'20 to 9,014.60 Cr in Mar'25, impacting operating profit, which peaked at 1,613.02 Cr in Mar'24 before declining to 1,489.49 Cr in Mar'25. Profit before tax showed a similar pattern, reaching a high of 1,298.52 Cr in Mar'24 but falling to 1,118.97 Cr in Mar'25. Profit after tax also fluctuated, with a peak of 962.86 Cr in Mar'24 and a decrease to 840.82 Cr in Mar'25. The company's total assets grew from 3,618.54 Cr in Mar'20 to 7,167.82 Cr in Mar'25, while total liabilities increased from 3,618.54 Cr to 7,167.82 Cr over the same period. Cash flow from operating activities was strong, peaking at 1,412.00 Cr in Mar'24 but declining to 1,003.00 Cr in Mar'25, contributing to a net cash outflow of 234.00 Cr in Mar'25. Overall, while Supreme Inds. has shown growth in sales and profits, the rising costs and fluctuations in profit margins indicate challenges in maintaining profitability.

View full answer

Who are the top shareholders of the Supreme Inds.?

06-Jun-2025

The top shareholders of Supreme Industries include promoters, with Jovial Investment And Trading Company Private Limited holding 16.12%, followed by foreign institutional investors at 22.93%, and 28 mutual fund schemes with 10.48%. The highest public shareholder is Nalanda India Fund Limited at 3.48%, while individual investors account for 11.93%.

The top shareholders of Supreme Industries include a mix of promoters, institutional investors, and individual shareholders. The majority shareholders are the promoters, with Jovial Investment And Trading Company Private Limited holding the highest stake at 16.12%. <BR><BR>In terms of institutional holdings, 28 mutual fund schemes collectively hold 10.48%, while foreign institutional investors (FIIs) have a significant presence with 22.93% of the shares. The highest public shareholder is Nalanda India Fund Limited, which holds 3.48%. Additionally, individual investors account for 11.93% of the total holdings.

View full answer

What is the bonus history of the Supreme Inds.?

06-Jun-2025

Supreme Industries Ltd announced a 1:1 bonus issue on November 13, 2006, with a record date of November 14, 2006, allowing shareholders to receive one additional share for each share held.

Supreme Industries Ltd has a bonus history that includes a 1:1 bonus issue announced with an ex-date of November 13, 2006. The record date for this bonus was November 14, 2006. This means that shareholders on record as of the record date were entitled to receive one additional share for every share they held. If you have any more questions about the company or its financials, feel free to ask!

View full answer
iScoreScore
Click here to find our call on this stock
Strong Sell
Sell
Hold
Buy
Strong Buy

Dashboard

1

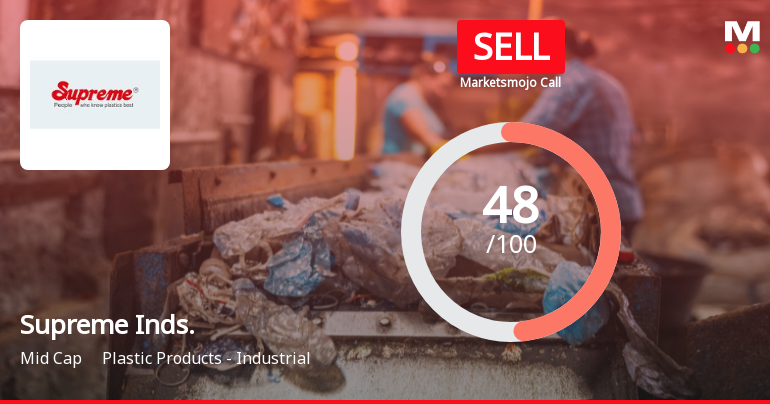
Poor long term growth as Operating profit has grown by an annual rate 0.06% of over the last 5 years

 
2

With ROE of 15.5, it has a Expensive valuation with a 7.1 Price to Book Value

3

Consistent Underperformance against the benchmark over the last 3 years

stock-summaryMojo Parameters

Mojo Parameters

Loading Valuation Snapshot...

Stock DNA

stock-summary
Industry

Plastic Products - Industrial

stock-summary
Market cap

INR 44,511 Cr (Mid Cap)

stock-summary
P/E

42.00

stock-summary
Industry P/E

33

stock-summary
Dividend Yield

1.03%

stock-summary
Debt Equity

-0.09

stock-summary
Return on Equity

15.46%

stock-summary
Price to Book

7.23

Revenue and Profits:
Net Sales:
2,718 Cr
(Quarterly Results - Jun 2026)
Net Profit:
281 Cr
stock-summaryTotal Returns
Total Returns (Price + Dividend) stock-summary
Dividend Yield (1.03%)
TimePeriod
Price Return
Dividend Return
Total Return
3 Months
-4.61%
0.72%
-3.89%
6 Months
-10.86%
0.64%
-10.22%
1 Year
-24.29%
0.83%
-23.46%
2 Years
-33.57%
1.30%
-32.27%
3 Years
-19.73%
2.43%
-17.3%
4 Years
75.31%
6.12%
81.43%
5 Years
61.29%
6.23%
67.52%

Latest dividend: 25 per share ex-dividend date: Jun-25-2026

Risk Adjusted Returns v/s stock-summary
Returns Beta
Icon
Beta has not been calculated since enough price history is not available
stock-summaryNews & Corporate Actions

News

Supreme Industries Ltd Falls 5.73%: Valuation Concerns and Downgrade Drive Weekly Decline

Key Events This Week

31 Aug: Stock opens at Rs.3,600, down 1.64% amid downgrade announcement

1 Sep: Downgrade to Sell confirmed, stock falls further to Rs.3,573.90 (-0.72%)

3 Sep: Valuation grade shifts from very expensive to expensive, price dips to Rs.3,509.00 (-0.93%)

4 Sep: Week closes at Rs.3,450.15, down 1.68% on the day and 5.73% for the week

Announcements stock-summary

Supreme Industries Limited - Analysts/Institutional Investor Meet/Con. Call Updates

18-Nov-2019 | Source : NSE

Supreme Industries Limited has informed the Exchange regarding Analysts/Institutional Investor Meet/Con. Call Updates

Updates

16-Sep-2019 | Source : NSE

Supreme Industries Limited has informed the Exchange regarding 'Submission of report submitted to SEBI in terms of Regulation 10 (7) of SEBI (Substantial Acquisition of Share and Takeover) Regulations, 2011.'.

Disclosure under SEBI Takeover Regulations

16-Sep-2019 | Source : NSE

Jovial Investment and trading Company Pvt ltd has informed the Exchange a copy of of Disclosure under Regulation 10(7) of SEBI ( SAST) Regulations, 2011.

Corporate Actions stock-summary

stock-summary
BOARD MEETING

No Upcoming Board Meetings

stock-summary
DIVIDEND

Supreme Industries Ltd has declared 1250% dividend, ex-date: 25 Jun 26

stock-summary
SPLITS

Supreme Industries Ltd has announced 2:10 stock split, ex-date: 18 Oct 10

stock-summary
BONUS

Supreme Industries Ltd has announced 1:1 bonus issue, ex-date: 13 Nov 06

stock-summary
RIGHTS

No Rights history available

stock-summaryKey Factors

Quality key factors stock-summary

Factor
Value
Sales Growth (5y)
11.26%
EBIT Growth (5y)
0.06%
EBIT to Interest (avg)
100.00
Debt to EBITDA (avg)
Net Debt is too low
Net Debt to Equity (avg)
-0.09
Sales to Capital Employed (avg)
1.97
Tax Ratio
22.40%
Dividend Payout Ratio
47.94%
Pledged Shares
0
Institutional Holding
36.16%
ROCE (avg)
26.73%
ROE (avg)
19.65%

Valuation key factors

Factor
Value
P/E Ratio
42
Industry P/E
33
Price to Book Value
7.10
EV to EBIT
36.83
EV to EBITDA
26.50
EV to Capital Employed
7.72
EV to Sales
3.82
PEG Ratio
2.65
Dividend Yield
1.04%
ROCE (Latest)
20.08%
ROE (Latest)
15.46%

Technicals key factors

Indicator
Weekly
Monthly
MACD
Mildly Bullish
Bearish
RSI
Bullish
No Signal
Bollinger Bands
Bearish
Bearish
Moving Averages
Mildly Bearish (Daily)
KST
Mildly Bullish
Bearish
Dow Theory
Mildly Bearish
No Trend
OBV
Mildly Bearish
No Trend
stock-summary Technical Indicator Scale: Bearish, Mildly Bearish, Sideways, Mildly Bullish, Bullish  Turned 
stock-summaryShareholding
Shareholding Snapshot : Jun 2026stock-summary
Shareholding Compare (%holding) stock-summary
Majority shareholders

Promoters

Pledged Promoter Holdings

None

Mutual Funds

Held by 33 Schemes (10.67%)

FIIs

Held by 555 FIIs (17.08%)

Promoter with highest holding

Jovial Investment And Trading Company Privatelimited (16.17%)

Highest Public shareholder

Nalanda India Fund Limited (2.97%)

Individual Investors Holdings

12.28%

stock-summaryFinancial
[
  {
    "link": "quarterly",
    "btn_text": "All Quarterly Results",
    "header": "Quarterly Results Snapshot (Consolidated) - Jun'26 - YoY",
    "rhs": [
      {
        "prefix": "Net Sales ",
        "suffix": "YoY Growth in quarter ended Jun 2026 is 4.16% vs -1.03% in Jun 2025",
        "dir": 1
      },
      {
        "prefix": "Consolidated Net Profit ",
        "suffix": "YoY Growth in quarter ended Jun 2026 is 38.76% vs -26.00% in Jun 2025",
        "dir": 1
      }
    ],
    "table": {
      "header": [
        "Jun'26",
        "Jun'25",
        "Change(%)"
      ],
      "body": [
        {
          "field": "Net Sales",
          "val1": "2,717.66",
          "val2": "2,609.21",
          "chgp": "4.16%",
          "chgp_class": "positive"
        },
        {
          "field": "Operating Profit (PBDIT) excl Other Income",
          "val1": "397.95",
          "val2": "318.88",
          "chgp": "24.80%",
          "chgp_class": "positive"
        },
        {
          "field": "Interest",
          "val1": "4.16",
          "val2": "2.77",
          "chgp": "50.18%",
          "chgp_class": "negative"
        },
        {
          "field": "Exceptional Items",
          "val1": "0.00",
          "val2": "0.00",
          "chgp": "",
          "chgp_class": "neutral"
        },
        {
          "field": "Consolidate Net Profit",
          "val1": "280.72",
          "val2": "202.30",
          "chgp": "38.76%",
          "chgp_class": "positive"
        },
        {
          "field": "Operating Profit Margin (Excl OI)",
          "val1": "14.64%",
          "val2": "12.22%",
          "chgp": "2.42%",
          "chgp_class": "positive"
        }
      ]
    }
  },
  {
    "link": "half-yearly",
    "btn_text": "All Half Yearly Results",
    "header": "Half Yearly Results Snapshot (Consolidated) - Sep'25",
    "rhs": [
      {
        "prefix": "Net Sales ",
        "suffix": " Growth in half year ended Sep 2025 is 1.91% vs 4.96% in Sep 2024",
        "dir": -1
      },
      {
        "prefix": "Consolidated Net Profit ",
        "suffix": " Growth in half year ended Sep 2025 is -23.53% vs 4.63% in Sep 2024",
        "dir": -1
      }
    ],
    "table": {
      "header": [
        "Sep'25",
        "Sep'24",
        "Change(%)"
      ],
      "body": [
        {
          "field": "Net Sales",
          "val1": "5,003.08",
          "val2": "4,909.30",
          "chgp": "1.91%",
          "chgp_class": "positive"
        },
        {
          "field": "Operating Profit (PBDIT) excl Other Income",
          "val1": "616.28",
          "val2": "706.56",
          "chgp": "-12.78%",
          "chgp_class": "negative"
        },
        {
          "field": "Interest",
          "val1": "8.60",
          "val2": "5.95",
          "chgp": "44.54%",
          "chgp_class": "negative"
        },
        {
          "field": "Exceptional Items",
          "val1": "0.00",
          "val2": "0.00",
          "chgp": "",
          "chgp_class": "neutral"
        },
        {
          "field": "Consolidate Net Profit",
          "val1": "367.04",
          "val2": "479.97",
          "chgp": "-23.53%",
          "chgp_class": "negative"
        },
        {
          "field": "Operating Profit Margin (Excl OI)",
          "val1": "12.32%",
          "val2": "14.39%",
          "chgp": "-2.07%",
          "chgp_class": "negative"
        }
      ]
    }
  },
  {
    "link": "nine-monthly",
    "btn_text": "All Nine Monthly Results",
    "header": "Nine Monthly Results Snapshot (Consolidated) - Dec'25",
    "rhs": [
      {
        "prefix": "Net Sales ",
        "suffix": "YoY Growth in nine months ended Dec 2025 is 3.65% vs 4.11% in Dec 2024",
        "dir": -1
      },
      {
        "prefix": "Consolidated Net Profit ",
        "suffix": "YoY Growth in nine months ended Dec 2025 is -21.97% vs -6.71% in Dec 2024",
        "dir": -1
      }
    ],
    "table": {
      "header": [
        "Dec'25",
        "Dec'24",
        "Change(%)"
      ],
      "body": [
        {
          "field": "Net Sales",
          "val1": "7,690.02",
          "val2": "7,419.18",
          "chgp": "3.65%",
          "chgp_class": "positive"
        },
        {
          "field": "Operating Profit (PBDIT) excl Other Income",
          "val1": "930.08",
          "val2": "1,015.38",
          "chgp": "-8.40%",
          "chgp_class": "negative"
        },
        {
          "field": "Interest",
          "val1": "20.00",
          "val2": "8.93",
          "chgp": "123.96%",
          "chgp_class": "negative"
        },
        {
          "field": "Exceptional Items",
          "val1": "0.00",
          "val2": "0.00",
          "chgp": "",
          "chgp_class": "neutral"
        },
        {
          "field": "Consolidate Net Profit",
          "val1": "520.41",
          "val2": "666.94",
          "chgp": "-21.97%",
          "chgp_class": "negative"
        },
        {
          "field": "Operating Profit Margin (Excl OI)",
          "val1": "12.09%",
          "val2": "13.69%",
          "chgp": "-1.60%",
          "chgp_class": "negative"
        }
      ]
    }
  },
  {
    "link": "annual",
    "btn_text": "All Annual Results",
    "header": "Annual Results Snapshot (Consolidated) - Mar'26",
    "rhs": [
      {
        "prefix": "Net Sales ",
        "suffix": "YoY Growth in year ended Mar 2026 is 7.38% vs 3.08% in Mar 2025",
        "dir": 1
      },
      {
        "prefix": "Consolidated Net Profit ",
        "suffix": "YoY Growth in year ended Mar 2026 is -0.72% vs -10.17% in Mar 2025",
        "dir": 1
      }
    ],
    "table": {
      "header": [
        "Mar'26",
        "Mar'25",
        "Change(%)"
      ],
      "body": [
        {
          "field": "Net Sales",
          "val1": "11,217.68",
          "val2": "10,446.25",
          "chgp": "7.38%",
          "chgp_class": "positive"
        },
        {
          "field": "Operating Profit (PBDIT) excl Other Income",
          "val1": "1,553.21",
          "val2": "1,431.65",
          "chgp": "8.49%",
          "chgp_class": "positive"
        },
        {
          "field": "Interest",
          "val1": "29.01",
          "val2": "11.90",
          "chgp": "143.78%",
          "chgp_class": "negative"
        },
        {
          "field": "Exceptional Items",
          "val1": "0.00",
          "val2": "0.00",
          "chgp": "",
          "chgp_class": "neutral"
        },
        {
          "field": "Consolidate Net Profit",
          "val1": "953.98",
          "val2": "960.88",
          "chgp": "-0.72%",
          "chgp_class": "negative"
        },
        {
          "field": "Operating Profit Margin (Excl OI)",
          "val1": "13.85%",
          "val2": "13.70%",
          "chgp": "0.15%",
          "chgp_class": "positive"
        }
      ]
    }
  }
]

Quarterly Results Snapshot (Consolidated) - Jun'26 - YoYstock-summary

Jun'26
Jun'25
Change(%)
Net Sales
2,717.66
2,609.21
4.16%
Operating Profit (PBDIT) excl Other Income
397.95
318.88
24.80%
Interest
4.16
2.77
50.18%
Exceptional Items
0.00
0.00
Consolidate Net Profit
280.72
202.30
38.76%
Operating Profit Margin (Excl OI)
14.64%
12.22%
2.42%
Values in Rs Cr.
Direction Arrows
Net Sales

YoY Growth in quarter ended Jun 2026 is 4.16% vs -1.03% in Jun 2025

Direction Arrows
Consolidated Net Profit

YoY Growth in quarter ended Jun 2026 is 38.76% vs -26.00% in Jun 2025

Half Yearly Results Snapshot (Consolidated) - Sep'25stock-summary

Sep'25
Sep'24
Change(%)
Net Sales
5,003.08
4,909.30
1.91%
Operating Profit (PBDIT) excl Other Income
616.28
706.56
-12.78%
Interest
8.60
5.95
44.54%
Exceptional Items
0.00
0.00
Consolidate Net Profit
367.04
479.97
-23.53%
Operating Profit Margin (Excl OI)
12.32%
14.39%
-2.07%
Values in Rs Cr.
Direction Arrows
Net Sales

Growth in half year ended Sep 2025 is 1.91% vs 4.96% in Sep 2024

Direction Arrows
Consolidated Net Profit

Growth in half year ended Sep 2025 is -23.53% vs 4.63% in Sep 2024

Nine Monthly Results Snapshot (Consolidated) - Dec'25stock-summary

Dec'25
Dec'24
Change(%)
Net Sales
7,690.02
7,419.18
3.65%
Operating Profit (PBDIT) excl Other Income
930.08
1,015.38
-8.40%
Interest
20.00
8.93
123.96%
Exceptional Items
0.00
0.00
Consolidate Net Profit
520.41
666.94
-21.97%
Operating Profit Margin (Excl OI)
12.09%
13.69%
-1.60%
Values in Rs Cr.
Direction Arrows
Net Sales

YoY Growth in nine months ended Dec 2025 is 3.65% vs 4.11% in Dec 2024

Direction Arrows
Consolidated Net Profit

YoY Growth in nine months ended Dec 2025 is -21.97% vs -6.71% in Dec 2024

Annual Results Snapshot (Consolidated) - Mar'26stock-summary

Mar'26
Mar'25
Change(%)
Net Sales
11,217.68
10,446.25
7.38%
Operating Profit (PBDIT) excl Other Income
1,553.21
1,431.65
8.49%
Interest
29.01
11.90
143.78%
Exceptional Items
0.00
0.00
Consolidate Net Profit
953.98
960.88
-0.72%
Operating Profit Margin (Excl OI)
13.85%
13.70%
0.15%
Values in Rs Cr.
Direction Arrows
Net Sales

YoY Growth in year ended Mar 2026 is 7.38% vs 3.08% in Mar 2025

Direction Arrows
Consolidated Net Profit

YoY Growth in year ended Mar 2026 is -0.72% vs -10.17% in Mar 2025

stock-summaryCompany CV
About Supreme Industries Ltd stock-summary
stock-summary
Supreme Industries Ltd
Mid Cap
Plastic Products - Industrial
Incorporated on February 17, 1942 at Wadala, Mumbai, Supreme Industries Limited (SIL) was promoted by the family of Kantilal K Modi. In August 1966, the Taparia family took control of the Company through outright purchase of shares. Today it has one of the largest plastic processors in the country, with a product range catering to both, the industrial and consumer segment.
Company Coordinates stock-summary
Company Details
612 Raheja Chambers, Nariman Point Mumbai Maharashtra : 400021
stock-summary
Tel: 91-22-22851656/22820072/59-60
stock-summary
investor@supreme.co.in
Registrar Details
Bigshare Services Pvt Ltd , E-2 , Ansa Industrial Estate, Saki Vihar Road, Saki Naka, Andheri (E), Mumbai