
Compare Shanti Gold with Similar Stocks
Dashboard
Healthy long term growth as Net Sales has grown by an annual rate of 55.50% and Operating profit at 84.96%
With a growth in Net Profit of 29.4%, the company declared Very Positive results in Mar 26
With ROCE of 28.9, it has a Attractive valuation with a 2.7 Enterprise value to Capital Employed
Stock DNA
Gems, Jewellery And Watches
INR 1,649 Cr (Micro Cap)
10.00
46
0.00%
0.23
25.86%
3.04
Total Returns (Price + Dividend) 
Shanti Gold for the last several years.
Risk Adjusted Returns v/s
Returns Beta

News

Shanti Gold International Ltd Upgraded to Buy on Strong Financials and Attractive Valuation
Shanti Gold International Ltd, a micro-cap player in the Gems, Jewellery and Watches sector, has seen its investment rating upgraded from Hold to Buy as of 22 May 2026. This upgrade reflects significant improvements across valuation metrics, financial trends, quality assessments, and technical indicators, signalling renewed investor confidence in the company’s prospects.
Read full news article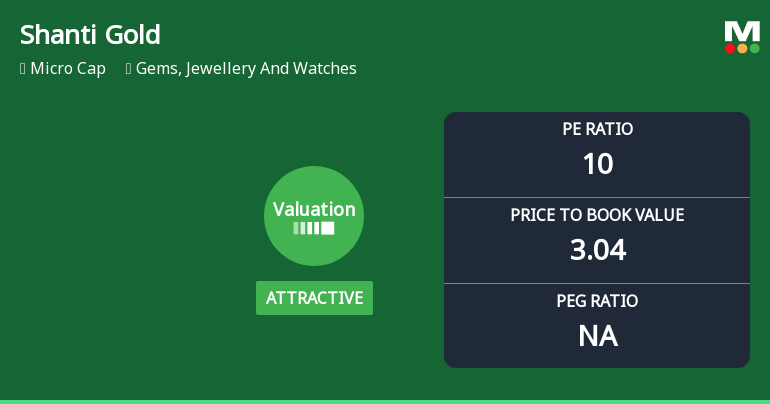
Shanti Gold International Ltd Valuation Turns Attractive Amid Strong Market Outperformance
Shanti Gold International Ltd has seen a notable shift in its valuation parameters, moving from a fair to an attractive rating, driven by improved price-to-earnings and price-to-book ratios relative to its historical averages and industry peers. This re-rating accompanies robust returns on capital and equity, positioning the micro-cap jewellery firm favourably within the Gems, Jewellery And Watches sector.
Read full news articleAre Shanti Gold International Ltd latest results good or bad?
Shanti Gold International Ltd reported its financial results for the quarter ending March 2026, showcasing significant revenue and profit growth. The company achieved a net profit of ₹51.93 crores, reflecting a substantial year-on-year increase of 465.18%. Revenue for the quarter reached ₹658.93 crores, marking a year-on-year growth of 121.65% and a quarter-on-quarter increase of 3.45%. This performance is attributed to strong demand in the domestic jewellery market, leading to the highest quarterly sales in the company's history. The operating profit margin, excluding other income, improved to 10.17%, up by 308 basis points from the previous year. The PAT margin also saw a notable rise, reaching 7.88%, nearly tripling from 3.09% in the same quarter last year. These metrics indicate effective cost management and operational leverage benefits from increased sales volumes. However, despite these impressive ...
Read full news article Announcements
Corporate Actions

No Upcoming Board Meetings

No Dividend history available

No Splits history available

No Bonus history available

No Rights history available
Quality key factors
Valuation key factors
Technicals key factors
 Technical Indicator Scale: Bearish, Mildly Bearish, Sideways, Mildly Bullish, Bullish Turned
 Shareholding Snapshot : Mar 2026
Shareholding Compare (%holding)
Promoters
0.01
Held by 0 Schemes
Held by 15 FIIs (2.18%)
Manojkumar N Jain (37.43%)
None
14.45%
Quarterly Results Snapshot (Standalone) - Mar'26 - QoQ

QoQ Growth in quarter ended Mar 2026 is 3.45% vs 48.10% in Dec 2025

QoQ Growth in quarter ended Mar 2026 is 29.40% vs -8.42% in Dec 2025
Half Yearly Results Snapshot (Standalone) - Sep'25
Not Applicable: The company has declared_date for only one period
Not Applicable: The company has declared_date for only one period
Nine Monthly Results Snapshot (Standalone) - Dec'25
Not Applicable: The company has declared_date for only one period
Not Applicable: The company has declared_date for only one period
Annual Results Snapshot (Standalone) - Mar'26
YoY Growth in year ended Mar 2026 is 82.46% vs 55.52% in Mar 2025
YoY Growth in year ended Mar 2026 is 159.01% vs 101.38% in Mar 2025
About Shanti Gold International Ltd

Company Coordinates


