
Compare Shashijit Infra. with Similar Stocks
Dashboard
Weak Long Term Fundamental Strength with an average Return on Capital Employed (ROCE) of 3.47%
- Poor long term growth as Net Sales has grown by an annual rate of 6.86% and Operating profit at 4.40% over the last 5 years
- Low ability to service debt as the company has a high Debt to EBITDA ratio of 7.15 times
Flat results in Mar 26
Below par performance in long term as well as near term
Total Returns (Price + Dividend) 
Latest dividend: 0 per share ex-dividend date: Sep-20-2019
Risk Adjusted Returns v/s
Returns Beta

News
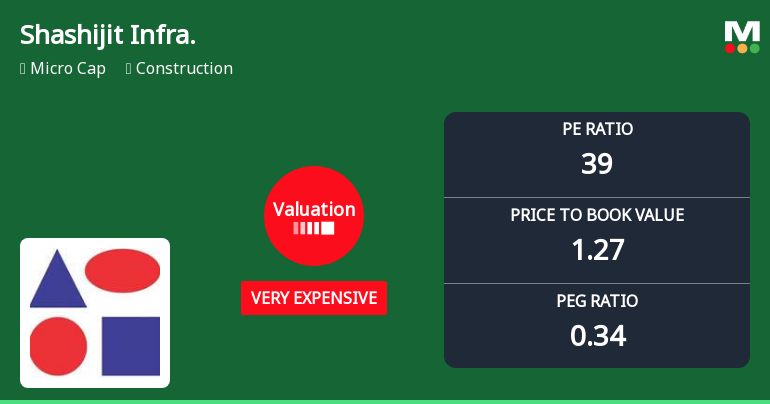
Shashijit Infraprojects Ltd Valuation Shifts Signal Elevated Price Risk
Shashijit Infraprojects Ltd, a micro-cap player in the construction sector, has witnessed a marked shift in its valuation parameters, moving from a risky to a very expensive category. Despite a modest day gain of 4.74%, the company’s price-to-earnings (P/E) and price-to-book value (P/BV) ratios have surged, raising questions about its price attractiveness relative to historical levels and peer benchmarks.
Read full news articleAre Shashijit Infraprojects Ltd latest results good or bad?
Shashijit Infraprojects Ltd's latest financial results for Q4 FY26 reveal a complex operational landscape. The company reported a net profit of ₹0.36 crore, a notable turnaround from a loss of ₹0.11 crore in the previous quarter. This profit was largely influenced by a significant tax credit, which raises concerns about the sustainability of profitability moving forward. Revenue for the quarter reached ₹6.65 crore, reflecting a year-on-year growth of 21.35% compared to ₹5.48 crore in Q4 FY25. However, this revenue growth was accompanied by a decline in operating margins, which fell to 2.26% from 4.05% in the prior quarter, indicating challenges in maintaining operational efficiency and cost management. The company's return on equity (ROE) remains low at 1.75%, suggesting limited effectiveness in generating returns on shareholder capital. Additionally, the operating profit before depreciation, interest, ...
Read full news article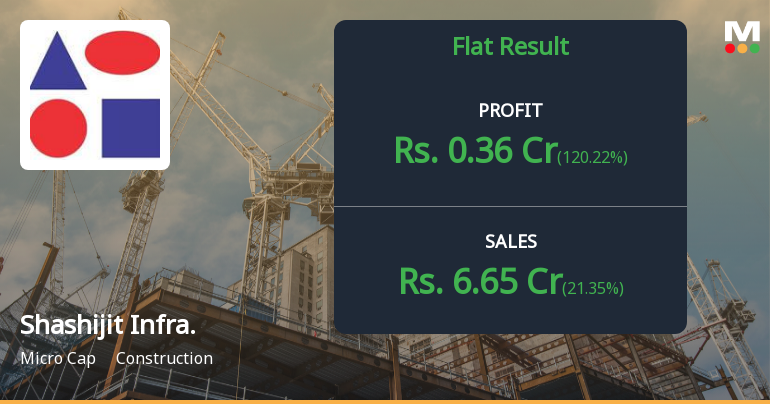
Shashijit Infraprojects Q4 FY26: Profit Turnaround Masks Deeper Structural Concerns
Shashijit Infraprojects Ltd., a Vapi-based micro-cap construction company with a market capitalisation of ₹19.00 crores, reported a surprising profit turnaround in Q4 FY26, posting a net profit of ₹0.36 crores after three consecutive quarters of losses. However, this quarter-on-quarter reversal from a loss of ₹0.11 crores in Q3 FY26 was primarily driven by an exceptional tax credit of ₹0.42 crores rather than operational improvements, raising serious questions about the sustainability of this performance.
Read full news article Announcements
Announcement Under Regulation 30 (LODR) - Receipt Of Common Oral Order Of The Honble High Court Of Gujarat
04-Jun-2026 | Source : BSEIntimation of receipt of Common Oral Order of the Honble High Court of Gujarat
Announcement under Regulation 30 (LODR)-Newspaper Publication
01-Jun-2026 | Source : BSENewspaper Clippings - Financial Results for the quarter and year ended 31st March 2026
Compliances-Reg.24(A)-Annual Secretarial Compliance
30-May-2026 | Source : BSEAnnual Secretarial Compliance Report for the Financial Year ended 31st March 2026
Corporate Actions

No Upcoming Board Meetings


Shashijit Infraprojects Ltd has announced 2:10 stock split, ex-date: 27 Oct 23

Shashijit Infraprojects Ltd has announced 1:5 bonus issue, ex-date: 12 Oct 18

No Rights history available
Quality key factors
Valuation key factors
Technicals key factors
 Technical Indicator Scale: Bearish, Mildly Bearish, Sideways, Mildly Bullish, Bullish Turned
 Shareholding Snapshot : Mar 2026
Shareholding Compare (%holding)
Non Institution
None
Held by 0 Schemes
Held by 0 FIIs
Ajitkumar Deepchand Jain (18.02%)
Rajesh Kumar Sodhani (12.38%)
53.48%
Quarterly Results Snapshot (Standalone) - Mar'26 - YoY

YoY Growth in quarter ended Mar 2026 is 21.35% vs -18.21% in Mar 2025
YoY Growth in quarter ended Mar 2026 is 120.22% vs -74.51% in Mar 2025
Half Yearly Results Snapshot (Standalone) - Sep'25
Growth in half year ended Sep 2025 is 3.88% vs -13.56% in Sep 2024
Growth in half year ended Sep 2025 is 161.54% vs -218.18% in Sep 2024
Nine Monthly Results Snapshot (Standalone) - Dec'25
YoY Growth in nine months ended Dec 2025 is -3.39% vs -15.75% in Dec 2024
YoY Growth in nine months ended Dec 2025 is 109.77% vs -424.39% in Dec 2024
Annual Results Snapshot (Standalone) - Mar'26
YoY Growth in year ended Mar 2026 is 2.49% vs -16.38% in Mar 2025
YoY Growth in year ended Mar 2026 is 115.76% vs -409.84% in Mar 2025
About Shashijit Infraprojects Ltd

Company Coordinates


