
Compare Shilchar Tech. with Similar Stocks
Dashboard
- PBT LESS OI(Q) At Rs 30.81 cr has Fallen at -45.3% (vs previous 4Q average)
- PAT(Q) At Rs 28.39 cr has Fallen at -38.7% (vs previous 4Q average)
- ROCE(HY) Lowest at 43.28%
With ROE of 32.2, it has a Very Expensive valuation with a 10.4 Price to Book Value
Despite the size of the company, domestic mutual funds hold only 0% of the company
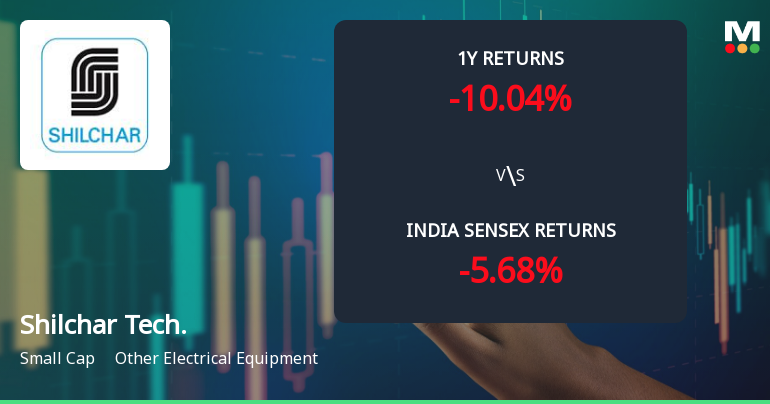
Underperformed the market in the last 1 year
Stock DNA
Other Electrical Equipment
INR 5,093 Cr (Small Cap)
32.00
52
0.28%
-0.50
32.22%
10.49
Total Returns (Price + Dividend) 
Latest dividend: 12.5 per share ex-dividend date: Aug-08-2025
Risk Adjusted Returns v/s
Returns Beta

News
Shilchar Technologies Ltd Shows Mildly Bullish Momentum Amid Mixed Technical Signals
Shilchar Technologies Ltd, a small-cap player in the Other Electrical Equipment sector, has recently exhibited a shift in price momentum from sideways to mildly bullish, supported by a blend of technical indicator signals. Despite a modest day gain of 3.01%, the stock’s technical landscape presents a nuanced picture, with bullish daily moving averages contrasting with mixed weekly and monthly momentum indicators. This analysis delves into the latest technical parameters, market context, and comparative returns to provide a comprehensive view for investors.
Read full news article
Shilchar Technologies Ltd Faces Mixed Technical Signals Amid Price Momentum Shift
Shilchar Technologies Ltd, a small-cap player in the Other Electrical Equipment sector, has experienced a notable shift in its technical momentum, reflecting a complex interplay of bullish and bearish indicators. Despite a recent downgrade in its Mojo Grade from Strong Sell to Sell, the stock’s long-term returns remain impressive, though short-term price action signals caution for investors.
Read full news article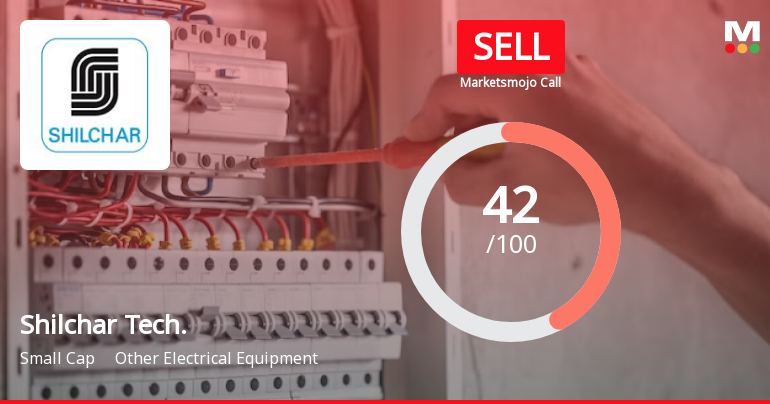
Shilchar Technologies Ltd is Rated Sell
Shilchar Technologies Ltd is rated 'Sell' by MarketsMOJO, with this rating last updated on 13 May 2026. However, the analysis and financial metrics discussed here reflect the stock's current position as of 21 July 2026, providing investors with the latest insights into its performance and outlook.
Read full news article Announcements
Announcement under Regulation 30 (LODR)-Newspaper Publication
19-Jul-2026 | Source : BSENewspaper Publication
Annual General Meeting FY 2025-2026
17-Jul-2026 | Source : BSEAGM Notice FY 2025-2026
Business Responsibility and Sustainability Reporting (BRSR)
17-Jul-2026 | Source : BSESubmission of BRSR Report for FY 2025-2026
Corporate Actions

No Upcoming Board Meetings

Shilchar Technologies Ltd has declared 125% dividend, ex-date: 31 Jul 26

No Splits history available

Shilchar Technologies Ltd has announced 1:2 bonus issue, ex-date: 06 Jun 25

No Rights history available
Quality key factors
Valuation key factors
Technicals key factors
 Technical Indicator Scale: Bearish, Mildly Bearish, Sideways, Mildly Bullish, Bullish Turned
 Shareholding Snapshot : Jun 2026
Shareholding Compare (%holding)
Promoters
None
Held by 1 Schemes (0.0%)
Held by 19 FIIs (2.57%)
Alay Jitendra Shah (23.68%)
Ravi Kirti Shah (4.96%)
17.64%
Quarterly Results Snapshot (Standalone) - Mar'26 - QoQ

QoQ Growth in quarter ended Mar 2026 is -10.93% vs -0.60% in Dec 2025
QoQ Growth in quarter ended Mar 2026 is -32.95% vs -7.84% in Dec 2025
Half Yearly Results Snapshot (Standalone) - Sep'25

Growth in half year ended Sep 2025 is 38.93% vs 36.92% in Sep 2024
Growth in half year ended Sep 2025 is 54.17% vs 39.06% in Sep 2024
Nine Monthly Results Snapshot (Standalone) - Dec'25
YoY Growth in nine months ended Dec 2025 is 27.86% vs 34.26% in Dec 2024
YoY Growth in nine months ended Dec 2025 is 41.86% vs 36.80% in Dec 2024
Annual Results Snapshot (Standalone) - Mar'26
YoY Growth in year ended Mar 2026 is 4.62% vs 57.01% in Mar 2025
YoY Growth in year ended Mar 2026 is 7.70% vs 59.81% in Mar 2025
About Shilchar Technologies Ltd

Company Coordinates


