Shilpa Medicare

  • Market Cap: Small Cap
  • Industry: Pharmaceuticals & Biotechnology
  • ISIN: INE790G01031
  • NSEID: SHILPAMED
  • BSEID: 530549
INR
759.60
19.55 (2.64%)
BSENSE

Aug 07, 03:30 PM

BSE+NSE Vol: 68.25 lacs

  • Price Points
  • Score
  • Mojo Parameters
  • Total Return
  • News and Corporate Actions
  • Key factors
  • Shareholding
  • Financials
  • CompanyCV
stock-summaryPrice Point
High/Low

1Day

52 Week

Valuation
Technical
Day's Volume

CASH

68.25 lacs (-30.57%) Volume

Shareholding (Jun 2026)

FII

11.38%

Held by 108 FIIs

DII

8.05%

Held by 9 DIIs

Promoter

40.13%

Why is Shilpa Medicare Ltd falling/rising?

08-Aug-2026

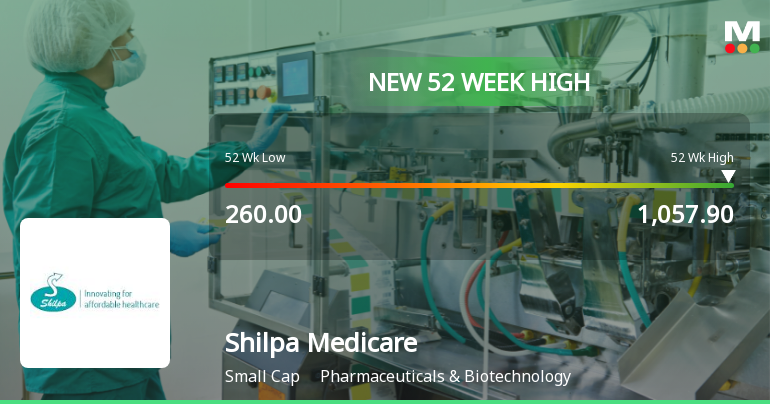
As of 07-Aug, Shilpa Medicare Ltd's stock price is rising to 759.60, up 2.64%. This increase is driven by strong performance metrics, significant investor interest, and positive financial results, with the stock outperforming the Sensex and nearing its 52-week high.

As of 07-Aug, Shilpa Medicare Ltd's stock price is rising, currently at 759.60, reflecting a change of 19.55 (2.64%) upwards. This increase can be attributed to several positive factors. The stock has shown impressive performance over various periods, with a 1-week return of +24.21% and a year-to-date return of +136.49%, significantly outperforming the Sensex, which has declined by 7.89% in the same timeframe. <BR><BR>Today, the stock has outperformed its sector by 2.52%, and it has been on a consecutive gain streak for the last six days, accumulating a total return of 25.63% during this period. Additionally, the stock is close to its 52-week high, just 3.55% away from Rs 786.55, and reached an intraday high of Rs 774.35, marking a 4.63% increase.<BR><BR>Investor participation has also risen, with a delivery volume of 31.24 lacs on 06 Aug, which is an increase of 298.32% compared to the 5-day average. The stock is trading above its moving averages for 5, 20, 50, 100, and 200 days, indicating a strong upward trend. Furthermore, the company has reported outstanding financial results, including a 14.85% growth in operating profit and consistent positive results over the last 12 quarters, contributing to a healthy long-term growth outlook.<BR><BR>Overall, the combination of strong performance metrics, rising investor interest, and positive financial results are driving the stock price of Shilpa Medicare Ltd higher.

View full answer

Should I buy, sell or hold Shilpa Medicare Ltd?

07-Aug-2026

Are Shilpa Medicare Ltd latest results good or bad?

06-Aug-2026

Shilpa Medicare Ltd's latest Q1 FY27 results are positive, with a net profit of ₹100.88 crore, up 115.14% year-on-year, and revenue of ₹465.78 crore, a 44.90% increase. Despite a slight decline from the previous quarter, the company shows strong growth and operational efficiency.

Shilpa Medicare Ltd's latest results for Q1 FY27 can be considered quite positive overall. The company reported a consolidated net profit of ₹100.88 crore, which reflects a remarkable year-on-year growth of 115.14%. This indicates a strong recovery and operational performance compared to the same quarter last year.<BR><BR>In terms of revenue, Shilpa Medicare achieved ₹465.78 crore, marking a significant year-on-year increase of 44.90%. This growth is particularly impressive given the challenging environment in the pharmaceutical sector. The operating margin, excluding other income, also improved to 29.26%, up from 28.51% in the same quarter last year, demonstrating effective cost management and operational efficiency.<BR><BR>While there was a slight decline of 6.41% in net profit compared to the previous quarter, the overall trajectory shows strong demand and a solid performance across its product portfolio, especially in active pharmaceutical ingredients (APIs) and formulations. The company's ability to maintain a high operating profit to interest coverage ratio of 11.26 times further underscores its financial stability.<BR><BR>In summary, despite some quarterly fluctuations, Shilpa Medicare's latest results highlight strong growth, improved margins, and operational excellence, positioning the company favorably in the market.

View full answer

How big is Shilpa Medicare?

11-Jun-2026

As of 10th June, Shilpa Medicare Ltd has a market capitalization of 11,074.00 Cr, with recent net sales of 1,538.70 Cr and a net profit of 243.33 Cr. The company reported shareholder's funds of 2,372.24 Cr and total assets of 3,297.74 Cr for the latest annual period ending in March 2025.

As of 10th June, Shilpa Medicare Ltd has a market capitalization of 11,074.00 Cr, categorizing it as a Small Cap company.<BR><BR>In the latest four quarters, Shilpa Medicare reported Net Sales of 1,538.70 Cr and a Net Profit of 243.33 Cr.<BR><BR>For the latest annual period ending in March 2025, the company had Shareholder's Funds of 2,372.24 Cr and Total Assets amounting to 3,297.74 Cr.

View full answer

Who are in the management team of Shilpa Medicare?

11-Jun-2026

The management team of Shilpa Medicare includes Chairman Omprakash Inani, Managing Director Vishnukant Bhutada, Whole-time Director Sharath Reddy Kalakota, and several Independent Directors: Arvind Vasudeva, Hetal Gandhi, Kamal K Sharma, and Anita Bandyopadhyay, along with Company Secretary Ritu Tiwary. They are responsible for the company's strategic direction and regulatory compliance.

The management team of Shilpa Medicare includes the following key individuals:<BR><BR>1. **Omprakash Inani** - Chairman (Non-Executive)<BR>2. **Vishnukant Bhutada** - Managing Director<BR>3. **Sharath Reddy Kalakota** - Whole-time Director<BR>4. **Arvind Vasudeva** - Independent Director<BR>5. **Hetal Gandhi** - Independent Director<BR>6. **Kamal K Sharma** - Independent Director<BR>7. **Anita Bandyopadhyay** - Independent Director<BR>8. **Ritu Tiwary** - Company Secretary & Compliance Officer<BR><BR>This team plays a crucial role in guiding the company's strategic direction and ensuring compliance with regulations.

View full answer

Who are the peers of the Shilpa Medicare?

11-Jun-2026

Shilpa Medicare's peers include Alembic Pharma, Concord Biotech, Alivus Life, Marksans Pharma, Viyash Scientifi, Sanofi Consumer, P & G Health Ltd, Akums Drugs, and Strides Pharma. Most peers have Below Average growth and management risk, with Shilpa Medicare also showing Below Average growth and management risk, while its 1-year return is 15.43%.

Peers: The peers of Shilpa Medicare are Alembic Pharma, Concord Biotech, Alivus Life, Marksans Pharma, Viyash Scientifi, Sanofi Consumer, P & G Health Ltd, Akums Drugs, and Strides Pharma.<BR><BR>Quality Snapshot: Excellent management risk is observed at Sanofi Consumer and P & G Health Ltd, while Good management risk is found at Alembic Pharma, Concord Biotech, Alivus Life, and Marksans Pharma. Average management risk is present at Viyash Scientifi, Akums Drugs, and Strides Pharma, and Shilpa Medicare has Below Average management risk. All peers exhibit Below Average growth except for Marksans Pharma, which has Above Average growth, while Shilpa Medicare also shows Below Average growth. Excellent capital structure is noted at Alembic Pharma, Concord Biotech, Alivus Life, Sanofi Consumer, and P & G Health Ltd, while Good capital structure is seen at Akums Drugs, and Below Average capital structure is present at Viyash Scientifi, Shilpa Medicare, and Strides Pharma.<BR><BR>Return Snapshot: Marksans Pharma has the highest 1-year return at -2.98%, while Concord Biotech has the lowest at -37.68%. Shilpa Medicare's 1-year return is 15.43%, which is significantly higher than Concord Biotech's return but lower than Marksans Pharma's. Additionally, Sanofi Consumer is the only peer with a negative six-month return at 1.07%.

View full answer

What does Shilpa Medicare do?

10-Jun-2026

Shilpa Medicare Ltd manufactures Active Pharmaceutical Ingredients (API) and provides formulation and development services in the Pharmaceuticals & Biotechnology sector. As of March 2026, it reported net sales of 437 Cr and a net profit of 108 Cr, with a market cap of INR 11,074 Cr.

Overview: <BR>Shilpa Medicare Ltd is engaged in the manufacturing of Active Pharmaceutical Ingredients (API), formulation, and development services within the Pharmaceuticals & Biotechnology industry, categorized as a Small Cap company.<BR><BR>History: <BR>Shilpa Medicare Ltd was incorporated as a Private Company on November 20, 1987, and transitioned to a Public Company in November 1993, changing its name to Shilpa Medicare Limited on February 17, 2003. The most recent quarterly results reported net sales and net profit for the period ending March 2026.<BR><BR>Financial Snapshot: <BR>Most recent Net Sales: 437 Cr (Quarterly Results - Mar 2026) <BR>Most recent Net Profit: 108 Cr (Quarterly Results - Mar 2026) <BR>Market-cap value: INR 11,074 Cr (Small Cap)<BR><BR>Key Metrics: <BR>P/E: 48.00 <BR>Industry P/E: 34 <BR>Dividend Yield: 0.09% <BR>Debt-Equity: 0.24 <BR>Return on Equity: 8.89% <BR>Price to Book: 4.29<BR><BR>Contact Details: <BR>Address: #12-6-214/A1, Hyderabad Road Raichur Karnataka : 584135 <BR>Tel: 91-8532-238704 <BR>Email: info@vbshilpa.com <BR>Website: http://www.vbshilpa.com

View full answer

When is the next results date for Shilpa Medicare Ltd?

15-May-2026

The next results date for Shilpa Medicare Ltd is 22 May 2026.

The next results date for Shilpa Medicare Ltd is scheduled for 22 May 2026.

View full answer

Is Shilpa Medicare overvalued or undervalued?

03-Dec-2025

As of December 2, 2025, Shilpa Medicare's stock is considered attractive due to its undervaluation, highlighted by a PE ratio of 40.69 and a PEG ratio of 0.21, despite recent underperformance against the Sensex.

As of 2 December 2025, Shilpa Medicare's valuation grade has moved from fair to attractive, indicating a more favorable assessment of its stock. The company appears to be undervalued, especially when considering its key ratios: a PE ratio of 40.69, an EV to EBITDA of 20.27, and a PEG ratio of 0.21, which suggests strong growth potential relative to its price. <BR><BR>In comparison to its peers, Shilpa Medicare's valuation stands out; for instance, Sun Pharma has a PE ratio of 37.36 and an EV to EBITDA of 24.69, while Cipla shows a PE of 22.57 and an EV to EBITDA of 15.96, both of which are lower than Shilpa's ratios. Despite recent underperformance against the Sensex, with a year-to-date return of -16.11% compared to the Sensex's 8.96%, the attractive valuation suggests that Shilpa Medicare may present a compelling investment opportunity moving forward.

View full answer

Is Shilpa Medicare technically bullish or bearish?

19-Nov-2025

As of November 18, 2025, Shilpa Medicare's technical trend has shifted to bearish, indicated by a bearish MACD, Bollinger Bands, and moving averages, despite a mildly bullish signal from Dow Theory on the weekly chart.

As of 18 November 2025, the technical trend for Shilpa Medicare has changed from mildly bearish to bearish. The current technical stance is bearish with moderate strength. Key indicators driving this stance include a bearish MACD on the weekly chart, bearish Bollinger Bands, and bearish moving averages on the daily timeframe. The KST is also bearish on the weekly chart, while the Dow Theory shows a mildly bullish signal on the weekly but is mildly bearish on the monthly. Overall, the combination of these indicators suggests a prevailing bearish sentiment in the market.

View full answer

How has been the historical performance of Shilpa Medicare?

19-Nov-2025

Shilpa Medicare has shown significant growth in net sales, increasing from 1,050.11 Cr in March 2023 to 1,286.41 Cr in March 2025, with improved operating profit and profitability metrics. The company's total assets and shareholder's funds have also risen, indicating a stronger financial position despite a slight decline in cash flow from operating activities.

Answer:<BR>The historical performance of Shilpa Medicare shows a significant increase in net sales, reaching 1,286.41 Cr in March 2025, up from 1,151.60 Cr in March 2024 and 1,050.11 Cr in March 2023. The total operating income mirrored this growth, with a rise to 1,286.41 Cr in March 2025. However, total expenditure also increased to 969.51 Cr in March 2025, compared to 907.11 Cr in March 2024. Operating profit (PBDIT) saw a substantial rise to 340.20 Cr in March 2025 from 252.66 Cr in March 2024, indicating improved operational efficiency. Profit before tax improved to 123.60 Cr in March 2025, up from 59.11 Cr in March 2024, while profit after tax also rose to 79.57 Cr from 36.74 Cr. The earnings per share increased to 4.0 in March 2025, compared to 3.67 in March 2024. <BR><BR>On the balance sheet side, total assets grew to 3,297.74 Cr in March 2025 from 3,082.98 Cr in March 2024, with total liabilities also increasing to 3,297.74 Cr. Shareholder's funds rose to 2,372.24 Cr in March 2025 from 1,808.69 Cr in March 2024, reflecting a stronger equity position. Cash flow from operating activities was 132.00 Cr in March 2025, slightly down from 136.00 Cr in March 2024, while cash flow from investing activities showed a negative trend at -198.00 Cr. The net cash outflow was -3.00 Cr in March 2025, indicating a slight decrease in cash reserves, which stood at 28.00 Cr at the end of March 2025.<BR><BR>Breakdown:<BR>Shilpa Medicare's financial performance over the years has demonstrated a consistent upward trend in net sales, which increased from 733.39 Cr in March 2019 to 1,286.41 Cr in March 2025. This growth in revenue has been accompanied by fluctuations in operating profit, which peaked at 340.20 Cr in March 2025, showcasing improved operational efficiency despite rising expenditures. The profit before tax also reflected a positive trajectory, moving from a loss of -34.47 Cr in March 2023 to a profit of 123.60 Cr in March 2025. The company's earnings per share have rebounded from a negative figure in March 2023 to 4.0 in March 2025, indicating a recovery in profitability. On the balance sheet, total assets and shareholder's funds have both increased significantly, highlighting a strengthening financial position, while cash flow from operating activities remained stable despite a slight decline. Overall, Shilpa Medicare's financial metrics indicate a robust recovery and growth trajectory in recent years.

View full answer

What is the bonus history of Shilpa Medicare?

19-Sep-2025

Shilpa Medicare's most recent bonus issue was a 1:1 bonus announced on October 3, 2025. Previously, the company issued a 1:2 bonus on July 16, 2013.

Shilpa Medicare has a notable bonus history. The most recent bonus issue was a 1:1 bonus announced with an ex-date of October 3, 2025. Prior to that, the company issued a 1:2 bonus on July 16, 2013, with a record date of July 18, 2013. This reflects the company's commitment to rewarding its shareholders through bonus shares over the years.

View full answer

Who are the top shareholders of the Shilpa Medicare?

17-Jul-2025

The top shareholders of Shilpa Medicare include promoter Vishnukant Chaturbhuj Bhutada with 6.51%, mutual funds with 4.05%, foreign institutional investors (FIIs) at 10.97%, and individual investors holding 24.43%. The highest public shareholder is Pivotal Enterprises Private Limited with 2.25%.

The top shareholders of Shilpa Medicare include the promoters, who are the majority shareholders. The promoter with the highest holding is Vishnukant Chaturbhuj Bhutada, owning 6.51% of the company. Additionally, mutual funds hold 4.05% through 8 schemes, while foreign institutional investors (FIIs) collectively own 10.97% through 99 FIIs. The highest public shareholder is Pivotal Enterprises Private Limited, which holds 2.25%. Individual investors account for 24.43% of the holdings.

View full answer

Has Shilpa Medicare declared dividend?

06-Jun-2025

Yes, Shilpa Medicare Ltd has declared a 110% dividend, amounting to ₹1.1 per share, with an ex-date of September 19, 2022. Despite this, the dividend yield is 0%, as total returns have primarily come from significant price appreciation over various periods.

Shilpa Medicare Ltd has declared a 110% dividend.<BR><BR>Dividend Details:<BR>- Percentage announced: 110%<BR>- Amount per share: 1.1<BR>- Ex-date: 19 Sep 22<BR><BR>Dividend Yield: 0%<BR><BR>Total Returns by Period:<BR>In the last 6 months, the price return was 6.35%, with no dividend return, resulting in a total return of 6.35%.<BR><BR>Over the past year, the price return was 72.64%, and there was no dividend return, leading to a total return of 72.64%.<BR><BR>In the 2-year period, the price return was 296.75%, with no dividend return, resulting in a total return of 296.75%.<BR><BR>For the 3-year period, the price return was 115.56%, with a dividend return of 0.26%, culminating in a total return of 115.82%.<BR><BR>In the 4-year period, the price return was 62.17%, with a dividend return of 0.39%, resulting in a total return of 62.56%.<BR><BR>Over the last 5 years, the price return was 95.73%, with a dividend return of 0.47%, leading to a total return of 96.2%.<BR><BR>Overall, Shilpa Medicare has declared a significant dividend, but the dividend yield remains at 0%. The total returns over various periods indicate strong price appreciation, particularly over longer time frames, despite the minimal contribution from dividends.

View full answer
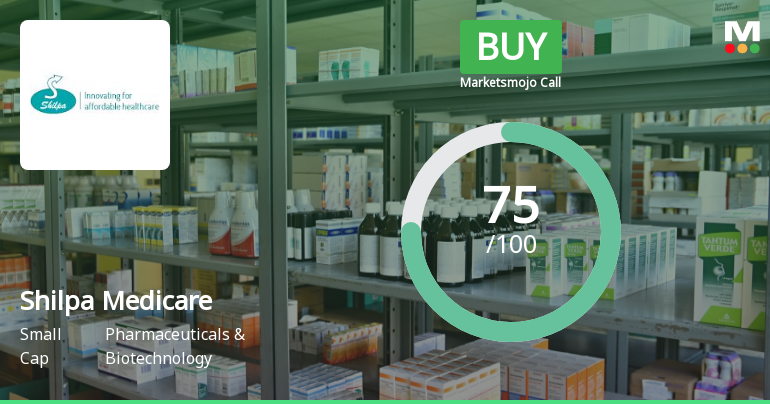
iScoreScore
Click here to find our call on this stock
Strong Sell
Sell
Hold
Buy
Strong Buy

Dashboard

1

Healthy long term growth as Operating profit has grown by an annual rate 31.89%

 
2

With a growth in Operating Profit of 14.85%, the company declared Outstanding results in Jun 26

3

Majority shareholders : Non Institution

 
4

Consistent Returns over the last 3 years

stock-summaryMojo Parameters

Mojo Parameters

Loading Valuation Snapshot...

Stock DNA

stock-summary
Industry

Pharmaceuticals & Biotechnology

stock-summary
Market cap

INR 14,555 Cr (Small Cap)

stock-summary
P/E

52.00

stock-summary
Industry P/E

37

stock-summary
Dividend Yield

0.07%

stock-summary
Debt Equity

0.24

stock-summary
Return on Equity

8.89%

stock-summary
Price to Book

5.59

Revenue and Profits:
Net Sales:
466 Cr
(Quarterly Results - Jun 2026)
Net Profit:
101 Cr
stock-summaryTotal Returns
Total Returns (Price + Dividend) stock-summary
Dividend Yield (0.07%)
TimePeriod
Price Return
Dividend Return
Total Return
3 Months
71.93%
0%
71.93%
6 Months
141.56%
0%
141.56%
1 Year
85.31%
0.11%
85.42%
2 Years
114.95%
0.14%
115.09%
3 Years
323.18%
0.27%
323.45%
4 Years
267.26%
0.57%
267.83%
5 Years
145.31%
0.54%
145.85%

Latest dividend: 0.5000060927313714 per share ex-dividend date: Sep-17-2025

Risk Adjusted Returns v/s stock-summary
Returns Beta
Icon
Beta has not been calculated since enough price history is not available
stock-summaryNews & Corporate Actions

News

Announcements stock-summary

Announcement under Regulation 30 (LODR)-Analyst / Investor Meet - Outcome

05-Aug-2026 | Source : BSE

Audio link of the Investor Conference call for Q1 FY27

Final Dividend For The FY 2025-26

05-Aug-2026 | Source : BSE

The record date for determining the shareholders entitled for payment of final dividend for FY 2025-26 if declared at the 39th AGM is Friday 4th September 2026.

Unaudited Standalone And Consolidated Financial Results For The Quarter Ended 30 June 2026

05-Aug-2026 | Source : BSE

Unaudited standalone and consolidated Financial Results for the Quarter ended 30 June 2026

Corporate Actions stock-summary

stock-summary
BOARD MEETING

No Upcoming Board Meetings

stock-summary
DIVIDEND

Shilpa Medicare Ltd has declared 100% dividend, ex-date: 17 Sep 25

stock-summary
SPLITS

Shilpa Medicare Ltd has announced 1:2 stock split, ex-date: 06 Nov 15

stock-summary
BONUS

Shilpa Medicare Ltd has announced 1:1 bonus issue, ex-date: 03 Oct 25

stock-summary
RIGHTS

No Rights history available

stock-summaryKey Factors

Quality key factors stock-summary

Factor
Value
Sales Growth (5y)
12.95%
EBIT Growth (5y)
31.89%
EBIT to Interest (avg)
2.94
Debt to EBITDA (avg)
3.81
Net Debt to Equity (avg)
0.24
Sales to Capital Employed (avg)
0.43
Tax Ratio
13.51%
Dividend Payout Ratio
12.49%
Pledged Shares
8.73%
Institutional Holding
19.44%
ROCE (avg)
5.01%
ROE (avg)
3.58%

Valuation key factors

Factor
Value
P/E Ratio
52
Industry P/E
37
Price to Book Value
5.73
EV to EBIT
43.81
EV to EBITDA
32.29
EV to Capital Employed
4.83
EV to Sales
9.19
PEG Ratio
0.51
Dividend Yield
0.07%
ROCE (Latest)
9.82%
ROE (Latest)
8.89%

Technicals key factors

Indicator
Weekly
Monthly
MACD
Bullish
Bullish
RSI
Bearish
No Signal
Bollinger Bands
Bullish
Bullish
Moving Averages
Bullish (Daily)
KST
Bullish
Bullish
Dow Theory
Bullish
Bullish
OBV
Bullish
Bullish
stock-summary Technical Indicator Scale: Bearish, Mildly Bearish, Sideways, Mildly Bullish, Bullish  Turned 
stock-summaryShareholding
Shareholding Snapshot : Jun 2026stock-summary
Shareholding Compare (%holding) stock-summary
Majority shareholders

Non Institution

Pledged Promoter Holdings

8.7265

Mutual Funds

Held by 11 Schemes (4.21%)

FIIs

Held by 108 FIIs (11.38%)

Promoter with highest holding

Vishnukant Chaturbhuj Bhutada (6.51%)

Highest Public shareholder

Suraj Kumar Inani (4.01%)

Individual Investors Holdings

27.67%

stock-summaryFinancial
[
  {
    "link": "quarterly",
    "btn_text": "All Quarterly Results",
    "header": "Quarterly Results Snapshot (Consolidated) - Jun'26 - QoQ",
    "rhs": [
      {
        "prefix": "Net Sales ",
        "suffix": "QoQ Growth in quarter ended Jun 2026 is 6.59% vs 6.51% in Mar 2026",
        "dir": 1
      },
      {
        "prefix": "Consolidated Net Profit ",
        "suffix": "QoQ Growth in quarter ended Jun 2026 is -6.41% vs 141.79% in Mar 2026",
        "dir": -1
      }
    ],
    "table": {
      "header": [
        "Jun'26",
        "Mar'26",
        "Change(%)"
      ],
      "body": [
        {
          "field": "Net Sales",
          "val1": "465.78",
          "val2": "436.99",
          "chgp": "6.59%",
          "chgp_class": "positive"
        },
        {
          "field": "Operating Profit (PBDIT) excl Other Income",
          "val1": "136.27",
          "val2": "119.71",
          "chgp": "13.83%",
          "chgp_class": "positive"
        },
        {
          "field": "Interest",
          "val1": "12.10",
          "val2": "13.66",
          "chgp": "-11.42%",
          "chgp_class": "positive"
        },
        {
          "field": "Exceptional Items",
          "val1": "0.00",
          "val2": "25.02",
          "chgp": "-100.00%",
          "chgp_class": "negative"
        },
        {
          "field": "Consolidate Net Profit",
          "val1": "100.88",
          "val2": "107.79",
          "chgp": "-6.41%",
          "chgp_class": "negative"
        },
        {
          "field": "Operating Profit Margin (Excl OI)",
          "val1": "29.26%",
          "val2": "27.39%",
          "chgp": "1.87%",
          "chgp_class": "positive"
        }
      ]
    }
  },
  {
    "link": "half-yearly",
    "btn_text": "All Half Yearly Results",
    "header": "Half Yearly Results Snapshot (Consolidated) - Sep'25",
    "rhs": [
      {
        "prefix": "Net Sales ",
        "suffix": " Growth in half year ended Sep 2025 is 8.66% vs 11.02% in Sep 2024",
        "dir": -1
      },
      {
        "prefix": "Consolidated Net Profit ",
        "suffix": " Growth in half year ended Sep 2025 is 184.22% vs 1,046.95% in Sep 2024",
        "dir": -1
      }
    ],
    "table": {
      "header": [
        "Sep'25",
        "Sep'24",
        "Change(%)"
      ],
      "body": [
        {
          "field": "Net Sales",
          "val1": "691.43",
          "val2": "636.31",
          "chgp": "8.66%",
          "chgp_class": "positive"
        },
        {
          "field": "Operating Profit (PBDIT) excl Other Income",
          "val1": "199.92",
          "val2": "159.52",
          "chgp": "25.33%",
          "chgp_class": "positive"
        },
        {
          "field": "Interest",
          "val1": "34.45",
          "val2": "49.29",
          "chgp": "-30.11%",
          "chgp_class": "positive"
        },
        {
          "field": "Exceptional Items",
          "val1": "0.00",
          "val2": "0.00",
          "chgp": "",
          "chgp_class": "neutral"
        },
        {
          "field": "Consolidate Net Profit",
          "val1": "90.95",
          "val2": "32.00",
          "chgp": "184.22%",
          "chgp_class": "positive"
        },
        {
          "field": "Operating Profit Margin (Excl OI)",
          "val1": "28.91%",
          "val2": "25.07%",
          "chgp": "3.84%",
          "chgp_class": "positive"
        }
      ]
    }
  },
  {
    "link": "nine-monthly",
    "btn_text": "All Nine Monthly Results",
    "header": "Nine Monthly Results Snapshot (Consolidated) - Dec'25",
    "rhs": [
      {
        "prefix": "Net Sales ",
        "suffix": "YoY Growth in nine months ended Dec 2025 is 15.29% vs 11.13% in Dec 2024",
        "dir": 1
      },
      {
        "prefix": "Consolidated Net Profit ",
        "suffix": "YoY Growth in nine months ended Dec 2025 is 112.50% vs 765.40% in Dec 2024",
        "dir": -1
      }
    ],
    "table": {
      "header": [
        "Dec'25",
        "Dec'24",
        "Change(%)"
      ],
      "body": [
        {
          "field": "Net Sales",
          "val1": "1,101.71",
          "val2": "955.61",
          "chgp": "15.29%",
          "chgp_class": "positive"
        },
        {
          "field": "Operating Profit (PBDIT) excl Other Income",
          "val1": "314.77",
          "val2": "240.17",
          "chgp": "31.06%",
          "chgp_class": "positive"
        },
        {
          "field": "Interest",
          "val1": "45.13",
          "val2": "61.04",
          "chgp": "-26.06%",
          "chgp_class": "positive"
        },
        {
          "field": "Exceptional Items",
          "val1": "-12.86",
          "val2": "0.00",
          "chgp": "",
          "chgp_class": "neutral"
        },
        {
          "field": "Consolidate Net Profit",
          "val1": "135.53",
          "val2": "63.78",
          "chgp": "112.50%",
          "chgp_class": "positive"
        },
        {
          "field": "Operating Profit Margin (Excl OI)",
          "val1": "28.57%",
          "val2": "25.13%",
          "chgp": "3.44%",
          "chgp_class": "positive"
        }
      ]
    }
  },
  {
    "link": "annual",
    "btn_text": "All Annual Results",
    "header": "Annual Results Snapshot (Consolidated) - Mar'26",
    "rhs": [
      {
        "prefix": "Net Sales ",
        "suffix": "YoY Growth in year ended Mar 2026 is 19.62% vs 11.71% in Mar 2025",
        "dir": 1
      },
      {
        "prefix": "Consolidated Net Profit ",
        "suffix": "YoY Growth in year ended Mar 2026 is 210.81% vs 145.65% in Mar 2025",
        "dir": 1
      }
    ],
    "table": {
      "header": [
        "Mar'26",
        "Mar'25",
        "Change(%)"
      ],
      "body": [
        {
          "field": "Net Sales",
          "val1": "1,538.87",
          "val2": "1,286.43",
          "chgp": "19.62%",
          "chgp_class": "positive"
        },
        {
          "field": "Operating Profit (PBDIT) excl Other Income",
          "val1": "434.71",
          "val2": "319.37",
          "chgp": "36.11%",
          "chgp_class": "positive"
        },
        {
          "field": "Interest",
          "val1": "58.79",
          "val2": "75.53",
          "chgp": "-22.16%",
          "chgp_class": "positive"
        },
        {
          "field": "Exceptional Items",
          "val1": "12.16",
          "val2": "-30.58",
          "chgp": "139.76%",
          "chgp_class": "positive"
        },
        {
          "field": "Consolidate Net Profit",
          "val1": "243.33",
          "val2": "78.29",
          "chgp": "210.81%",
          "chgp_class": "positive"
        },
        {
          "field": "Operating Profit Margin (Excl OI)",
          "val1": "28.25%",
          "val2": "24.83%",
          "chgp": "3.42%",
          "chgp_class": "positive"
        }
      ]
    }
  }
]

Quarterly Results Snapshot (Consolidated) - Jun'26 - QoQstock-summary

Jun'26
Mar'26
Change(%)
Net Sales
465.78
436.99
6.59%
Operating Profit (PBDIT) excl Other Income
136.27
119.71
13.83%
Interest
12.10
13.66
-11.42%
Exceptional Items
0.00
25.02
-100.00%
Consolidate Net Profit
100.88
107.79
-6.41%
Operating Profit Margin (Excl OI)
29.26%
27.39%
1.87%
Values in Rs Cr.
Direction Arrows
Net Sales

QoQ Growth in quarter ended Jun 2026 is 6.59% vs 6.51% in Mar 2026

Direction Arrows
Consolidated Net Profit

QoQ Growth in quarter ended Jun 2026 is -6.41% vs 141.79% in Mar 2026

Half Yearly Results Snapshot (Consolidated) - Sep'25stock-summary

Sep'25
Sep'24
Change(%)
Net Sales
691.43
636.31
8.66%
Operating Profit (PBDIT) excl Other Income
199.92
159.52
25.33%
Interest
34.45
49.29
-30.11%
Exceptional Items
0.00
0.00
Consolidate Net Profit
90.95
32.00
184.22%
Operating Profit Margin (Excl OI)
28.91%
25.07%
3.84%
Values in Rs Cr.
Direction Arrows
Net Sales

Growth in half year ended Sep 2025 is 8.66% vs 11.02% in Sep 2024

Direction Arrows
Consolidated Net Profit

Growth in half year ended Sep 2025 is 184.22% vs 1,046.95% in Sep 2024

Nine Monthly Results Snapshot (Consolidated) - Dec'25stock-summary

Dec'25
Dec'24
Change(%)
Net Sales
1,101.71
955.61
15.29%
Operating Profit (PBDIT) excl Other Income
314.77
240.17
31.06%
Interest
45.13
61.04
-26.06%
Exceptional Items
-12.86
0.00
Consolidate Net Profit
135.53
63.78
112.50%
Operating Profit Margin (Excl OI)
28.57%
25.13%
3.44%
Values in Rs Cr.
Direction Arrows
Net Sales

YoY Growth in nine months ended Dec 2025 is 15.29% vs 11.13% in Dec 2024

Direction Arrows
Consolidated Net Profit

YoY Growth in nine months ended Dec 2025 is 112.50% vs 765.40% in Dec 2024

Annual Results Snapshot (Consolidated) - Mar'26stock-summary

Mar'26
Mar'25
Change(%)
Net Sales
1,538.87
1,286.43
19.62%
Operating Profit (PBDIT) excl Other Income
434.71
319.37
36.11%
Interest
58.79
75.53
-22.16%
Exceptional Items
12.16
-30.58
139.76%
Consolidate Net Profit
243.33
78.29
210.81%
Operating Profit Margin (Excl OI)
28.25%
24.83%
3.42%
Values in Rs Cr.
Direction Arrows
Net Sales

YoY Growth in year ended Mar 2026 is 19.62% vs 11.71% in Mar 2025

Direction Arrows
Consolidated Net Profit

YoY Growth in year ended Mar 2026 is 210.81% vs 145.65% in Mar 2025

stock-summaryCompany CV
About Shilpa Medicare Ltd stock-summary
stock-summary
Shilpa Medicare Ltd
Small Cap
Pharmaceuticals & Biotechnology
Shilpa Medicare Limited, formerly known as Shilpa Antibiotics Private Limited was incorporated as a Private Company on November 20, 1987. The Company changed the status to Public and the name of the Company changed to Shilpa Antibiotics Limited in November, 1993 and later on, was changed to 'Shilpa Medicare Limited' on February 17, 2003. The Company has been promoted by Vishnukant C. Bhutada and his Associates and is engaged in manufacturing of API, Formulation and Development service.
Company Coordinates stock-summary
Company Details
#12-6-214/A1, Hyderabad Road Raichur Karnataka : 584135
stock-summary
Tel: 91-8532-238704
stock-summary
info@vbshilpa.com
Registrar Details
Karvy Computershare Pvt Ltd, Plot No 17-24 , Near Image Hospital,, Reliance Cybervilae,Vithalrao Nagar,, Madhapur, Hyderabad