
Compare S C I with Similar Stocks
Dashboard
Strong ability to service debt as the company has a low Debt to EBITDA ratio of 1.23 times
Positive results in Mar 26
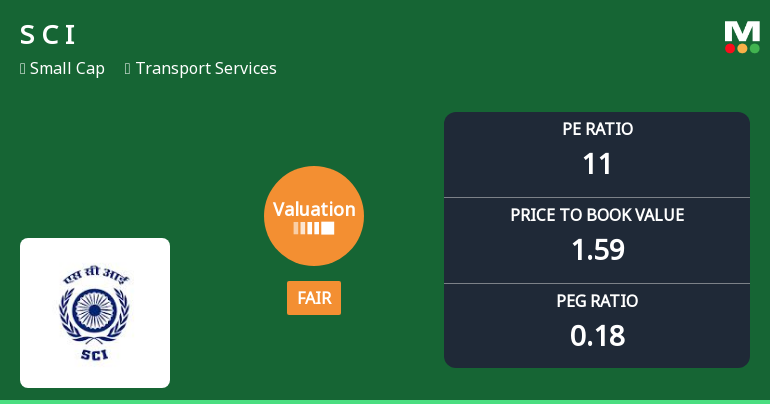
With ROCE of 9.9, it has a Fair valuation with a 1.5 Enterprise value to Capital Employed
Increasing Participation by Institutional Investors
Market Beating performance in long term as well as near term
Stock DNA
Transport Services
INR 14,549 Cr (Small Cap)
11.00
10
4.18%
0.25
14.87%
1.59
Total Returns (Price + Dividend) 
Latest dividend: 3.511565999632825 per share ex-dividend date: Feb-17-2026
Risk Adjusted Returns v/s
Returns Beta

News
Shipping Corporation of India Ltd: Valuation Shifts Signal Caution Amid Strong Returns
Shipping Corporation of India Ltd (SCI), a key player in the Transport Services sector, has experienced a notable shift in its valuation parameters, moving from a very attractive to a fair valuation grade. This change reflects evolving market perceptions amid fluctuating price-to-earnings (P/E) and price-to-book value (P/BV) ratios, alongside peer comparisons and historical benchmarks. Investors are now reassessing the stock’s price attractiveness in light of these developments.
Read full news article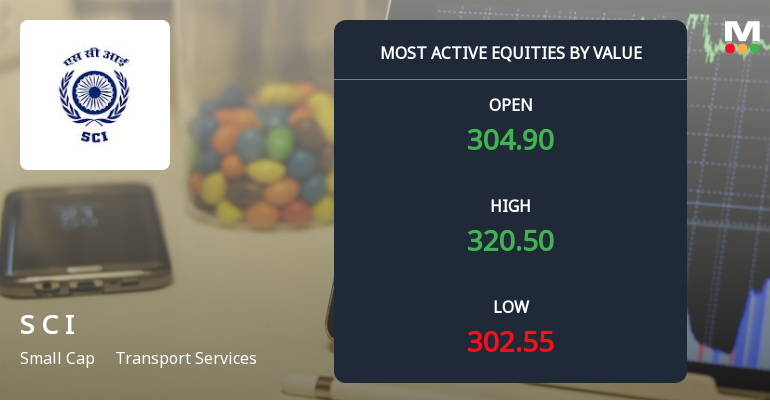
Shipping Corporation of India Ltd Sees Robust Trading Activity Amid Sector Gains
Shipping Corporation of India Ltd (SCI) emerged as one of the most actively traded stocks by value on 15 June 2026, registering a significant intraday rally that outpaced both its sector and the broader market. The stock’s strong performance, coupled with notable institutional interest and high liquidity, underscores its growing appeal among investors despite a recent downgrade in its mojo grade.
Read full news article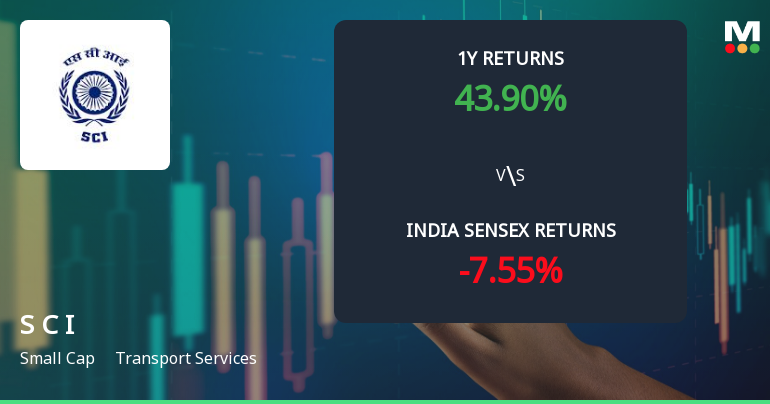
Shipping Corporation of India Ltd Sees Bullish Momentum Amid Technical Upgrades
Shipping Corporation of India Ltd (SCI) has experienced a notable shift in its technical momentum, moving from a mildly bullish stance to a more confident bullish trend. Despite some mixed signals from key indicators such as RSI and OBV, the overall technical landscape suggests strengthening price momentum, supported by positive MACD and moving average trends. This development comes as the stock trades at ₹297.00, up 3.77% on 15 Jun 2026, signalling renewed investor interest amid a challenging transport services sector.
Read full news article Announcements
Announcement under Regulation 30 (LODR)-Change in Management
02-Jun-2026 | Source : BSEDisclosure under Regulation 30 of SEBI (Listing Obligations and Disclosure Requirements) Regulations 2015- Change in Management
Announcement under Regulation 30 (LODR)-Change in Management
01-Jun-2026 | Source : BSEDisclosure under Regulation 30 of SEBI (LODR) Regulations 2015- change in senior management
Announcement under Regulation 30 (LODR)-Change in Directorate
01-Jun-2026 | Source : BSEIntimation under Regulation 30 of SEBI (Listing Obligations and Disclosure Requirements) Regulations 2015
Corporate Actions

No Upcoming Board Meetings

Shipping Corporation of India Ltd has declared 35% dividend, ex-date: 17 Feb 26

No Splits history available

Shipping Corporation of India Ltd has announced 1:2 bonus issue, ex-date: 29 Oct 08

No Rights history available
Quality key factors
Valuation key factors
Technicals key factors
 Technical Indicator Scale: Bearish, Mildly Bearish, Sideways, Mildly Bullish, Bullish Turned
 Shareholding Snapshot : Mar 2026
Shareholding Compare (%holding)
Promoters
None
Held by 20 Schemes (0.6%)
Held by 146 FIIs (8.98%)
President Of India (63.75%)
Life Insurance Corporation Of India (1.06%)
20.94%
Quarterly Results Snapshot (Consolidated) - Mar'26 - QoQ

QoQ Growth in quarter ended Mar 2026 is -6.11% vs 20.38% in Dec 2025
QoQ Growth in quarter ended Mar 2026 is -0.09% vs 114.09% in Dec 2025
Half Yearly Results Snapshot (Consolidated) - Sep'25
Growth in half year ended Sep 2025 is -10.46% vs 29.29% in Sep 2024
Growth in half year ended Sep 2025 is -6.79% vs 145.61% in Sep 2024
Nine Monthly Results Snapshot (Consolidated) - Dec'25
YoY Growth in nine months ended Dec 2025 is -0.33% vs 17.79% in Dec 2024
YoY Growth in nine months ended Dec 2025 is 44.02% vs 77.15% in Dec 2024
Annual Results Snapshot (Consolidated) - Mar'26
YoY Growth in year ended Mar 2026 is 3.10% vs 11.08% in Mar 2025

YoY Growth in year ended Mar 2026 is 60.38% vs 24.24% in Mar 2025
About Shipping Corporation of India Ltd

Company Coordinates


