
Compare Shiva Texyarn with Similar Stocks
Dashboard
Low ability to service debt as the company has a high Debt to EBITDA ratio of 2.15 times
- Poor long term growth as Net Sales has grown by an annual rate of 0.78% over the last 5 years
- Low ability to service debt as the company has a high Debt to EBITDA ratio of 2.15 times
- The company has been able to generate a Return on Equity (avg) of 5.15% signifying low profitability per unit of shareholders funds
Negative results in Mar 26
Underperformed the market in the last 1 year
Stock DNA
Garments & Apparels
INR 200 Cr (Micro Cap)
20.00
23
0.39%
0.43
7.04%
1.36
Total Returns (Price + Dividend) 
Latest dividend: 0.6 per share ex-dividend date: Aug-14-2025
Risk Adjusted Returns v/s
Returns Beta

News

Shiva Texyarn Ltd Upgraded to Sell as Financial and Technical Metrics Shift
Shiva Texyarn Ltd, a micro-cap player in the Garments & Apparels sector, has seen its investment rating upgraded from Strong Sell to Sell as of 1 June 2026. This change reflects a nuanced shift across four key parameters: Quality, Valuation, Financial Trend, and Technicals. Despite ongoing challenges in profitability and sales, improvements in certain financial metrics and valuation appeal have contributed to this reassessment.
Read full news article
Shiva Texyarn Ltd Valuation Shifts to Very Attractive Amid Market Headwinds
Shiva Texyarn Ltd, a micro-cap player in the Garments & Apparels sector, has seen a notable shift in its valuation parameters, moving from an attractive to a very attractive rating. Despite recent share price declines and underperformance relative to the Sensex, the company’s improved price-to-earnings and price-to-book ratios suggest a more compelling entry point for investors willing to navigate sectoral and market challenges.
Read full news article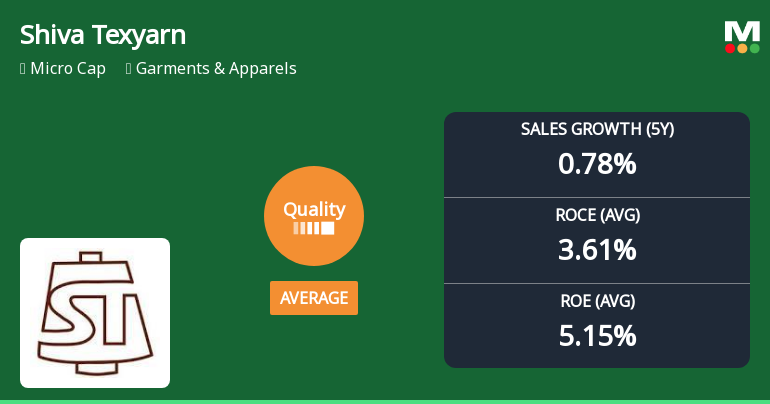
Shiva Texyarn Ltd Quality Grade Upgrade: A Closer Look at Business Fundamentals
Shiva Texyarn Ltd, a micro-cap player in the Garments & Apparels sector, has seen its quality grade upgraded from below average to average as of 5 January 2026. Despite this improvement, the company’s fundamentals present a complex picture with modest sales growth, high leverage, and moderate returns on capital. Investors should carefully weigh these factors amid the stock’s recent underperformance against the broader market.
Read full news article Announcements
Announcement under Regulation 30 (LODR)-Newspaper Publication
01-Jun-2026 | Source : BSENewspaper publication of the audited financial results (Standalone & Consolidated) of the Company for the year ended 31.03.2026.
Corporate Action-Board approves Dividend
27-May-2026 | Source : BSETo Recommended a dividend of Rs. 0.60 per Share having face value of Rs.10/- each for the financial year 2025-26 subject to the approval of shareholders at the ensuring annual general Meeting.
Announcement under Regulation 30 (LODR)-Change in Management
27-May-2026 | Source : BSESri M Gopalakrishnan is elevated as a Chief Operating Officer (Lamination Division) under the category of Senior Management Personnel of the Company w.e.f 27.05.2026 and Sri G K Raman is appointed as President - Strategic Affairs under the category of Senior Management Personnel of the Company w.e.f 27.05.2026.
Corporate Actions

No Upcoming Board Meetings

Shiva Texyarn Ltd has declared 6% dividend, ex-date: 14 Aug 25

No Splits history available

No Bonus history available

No Rights history available
Quality key factors
Valuation key factors
Technicals key factors
 Technical Indicator Scale: Bearish, Mildly Bearish, Sideways, Mildly Bullish, Bullish Turned
 Shareholding Snapshot : Mar 2026
Shareholding Compare (%holding)
Promoters
None
Held by 0 Schemes
Held by 0 FIIs
Vedanayagam Hospital Private Limited (66.04%)
Sonia Gulati (3.77%)
21.99%
Quarterly Results Snapshot (Consolidated) - Mar'26 - QoQ

QoQ Growth in quarter ended Mar 2026 is 8.44% vs -27.25% in Dec 2025

QoQ Growth in quarter ended Mar 2026 is -80.98% vs -71.99% in Dec 2025
Half Yearly Results Snapshot (Consolidated) - Sep'25
Growth in half year ended Sep 2025 is 16.28% vs -17.48% in Sep 2024
Growth in half year ended Sep 2025 is 100.73% vs 148.58% in Sep 2024
Nine Monthly Results Snapshot (Consolidated) - Dec'25
YoY Growth in nine months ended Dec 2025 is 11.48% vs -12.79% in Dec 2024
YoY Growth in nine months ended Dec 2025 is 68.08% vs 137.07% in Dec 2024
Annual Results Snapshot (Consolidated) - Mar'26
YoY Growth in year ended Mar 2026 is 5.52% vs -3.75% in Mar 2025
YoY Growth in year ended Mar 2026 is -15.34% vs 211.98% in Mar 2025
About Shiva Texyarn Ltd

Company Coordinates


