
Compare Shivalik Rasayan with Similar Stocks
Dashboard
Poor Management Efficiency with a low ROE of 4.26%
- The company has been able to generate a Return on Equity (avg) of 4.26% signifying low profitability per unit of shareholders funds
Poor long term growth as Operating profit has grown by an annual rate -1.67% of over the last 5 years
Flat results in Mar 26
Consistent Underperformance against the benchmark over the last 3 years
Stock DNA
Pesticides & Agrochemicals
INR 335 Cr (Micro Cap)
29.00
45
0.24%
0.13
1.98%
0.55
Total Returns (Price + Dividend) 
Latest dividend: 0.5011050305198905 per share ex-dividend date: Sep-19-2025
Risk Adjusted Returns v/s
Returns Beta

News
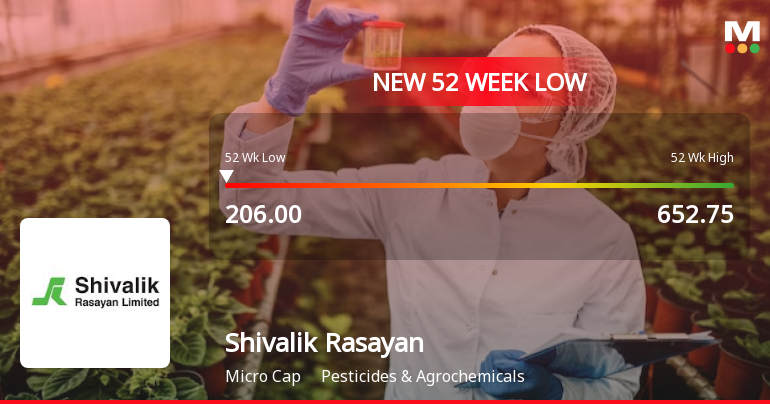
Five Consecutive Losses Push Shivalik Rasayan Ltd to a New 52-Week Low
For the fifth consecutive session, Shivalik Rasayan Ltd closed lower, slipping to a fresh 52-week low of Rs 206 on 25 Jun 2026, marking a 6.32% decline over this losing streak despite a broadly positive market backdrop.
Read full news article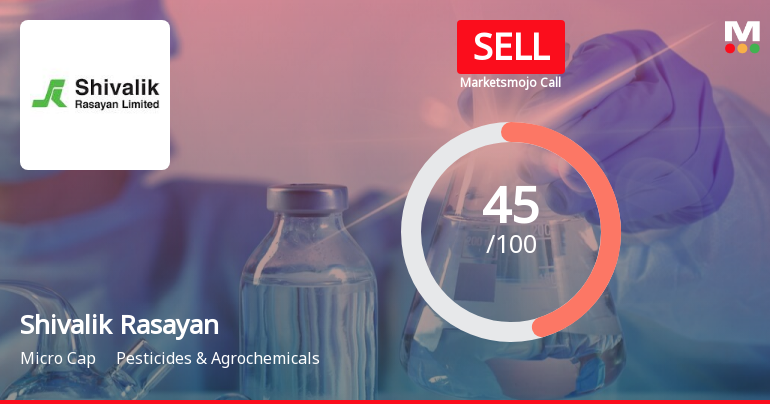
Shivalik Rasayan Ltd is Rated Sell
Shivalik Rasayan Ltd is rated 'Sell' by MarketsMOJO, with this rating last updated on 25 May 2026. However, the analysis and financial metrics presented here reflect the company’s current position as of 22 June 2026, providing investors with the latest insights into its performance and outlook.
Read full news article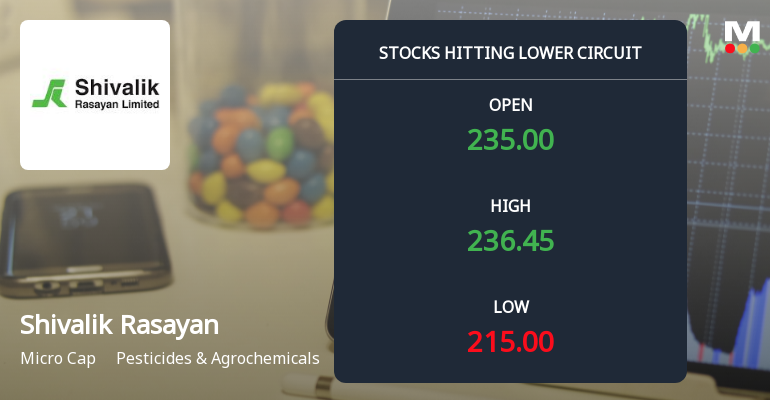
Below All Moving Averages and Now at Lower Circuit: Shivalik Rasayan Ltd Loses 1.72% in a Single Session
At Rs 222.85, sellers were still queuing — but there were no buyers willing to take the other side. Shivalik Rasayan Ltd locked at its lower circuit of 5% on 15 Jun 2026, with unfilled sell orders and a frozen price, signalling persistent selling pressure in this micro-cap stock.
Read full news article Announcements
Corporate Actions

No Upcoming Board Meetings

Shivalik Rasayan Ltd has declared 10% dividend, ex-date: 19 Sep 25

Shivalik Rasayan Ltd has announced 5:10 stock split, ex-date: 19 Apr 18

Shivalik Rasayan Ltd has announced 1:4 bonus issue, ex-date: 19 Apr 18

No Rights history available
Quality key factors
Valuation key factors
Technicals key factors
 Technical Indicator Scale: Bearish, Mildly Bearish, Sideways, Mildly Bullish, Bullish Turned
 Shareholding Snapshot : Mar 2026
Shareholding Compare (%holding)
Non Institution
None
Held by 0 Schemes
Held by 11 FIIs (4.2%)
Growel Remedies Limited (47.37%)
Ginnerup Capital Aps (3.22%)
31.84%
Quarterly Results Snapshot (Consolidated) - Mar'26 - YoY

YoY Growth in quarter ended Mar 2026 is 48.18% vs -2.58% in Mar 2025

YoY Growth in quarter ended Mar 2026 is 9.69% vs 20.06% in Mar 2025
Half Yearly Results Snapshot (Consolidated) - Sep'25
Growth in half year ended Sep 2025 is 16.60% vs 19.44% in Sep 2024
Growth in half year ended Sep 2025 is -34.79% vs 24.26% in Sep 2024
Nine Monthly Results Snapshot (Consolidated) - Dec'25
YoY Growth in nine months ended Dec 2025 is 9.41% vs 20.14% in Dec 2024
YoY Growth in nine months ended Dec 2025 is -40.55% vs 40.35% in Dec 2024
Annual Results Snapshot (Consolidated) - Mar'26
YoY Growth in year ended Mar 2026 is 18.04% vs 14.21% in Mar 2025
YoY Growth in year ended Mar 2026 is -27.31% vs 2.08% in Mar 2025
About Shivalik Rasayan Ltd

Company Coordinates


