
Compare Shoe Carnival, Inc. with Similar Stocks
Dashboard
1
High Management Efficiency with a high ROE of 18.93%
2
Company has a low Debt to Equity ratio (avg) at times
3
Healthy long term growth as Operating profit has grown by an annual rate 33.75%
4
Flat results in Jul 25
5
With ROE of 10.19%, it has a attractive valuation with a 1.21 Price to Book Value
6
High Institutional Holdings at 83.75%
7
Consistent Underperformance against the benchmark over the last 3 years
Total Returns (Price + Dividend) 
TimePeriod
Price Return
Dividend Return
Total Return
3 Months
-12.18%
0%
-12.18%
6 Months
-42.42%
0%
-42.42%
1 Year
-42.92%
0%
-42.92%
2 Years
-8.59%
0%
-8.59%
3 Years
-23.15%
0%
-23.15%
4 Years
-36.98%
0%
-36.98%
5 Years
50.6%
0%
50.6%
Shoe Carnival, Inc. for the last several years.
Risk Adjusted Returns v/s
News
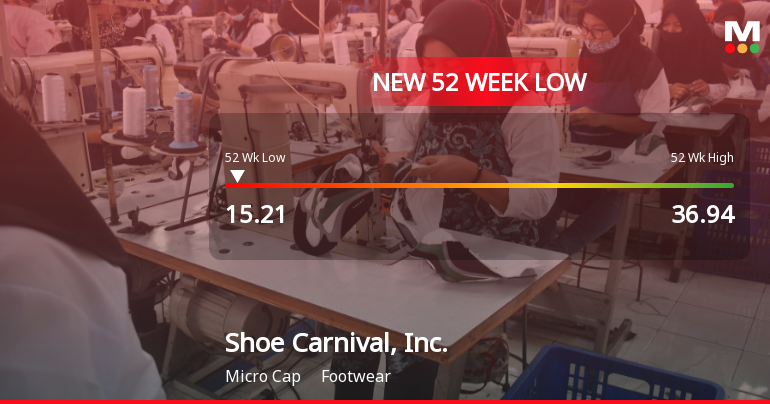
Shoe Carnival, Inc. Hits New 52-Week Low at $15.21
Shoe Carnival, Inc. has hit a new 52-week low, reflecting ongoing challenges in the competitive footwear market. The company's stock has fallen significantly over the past year, while its market capitalization is categorized as microcap. Despite a high dividend yield, Shoe Carnival faces declining profits and inventory management issues.
Read full news article Announcements

No announcement available
Corporate Actions
No corporate action available
Quality key factors
Factor
Value
Sales Growth (5y)
3.69%
EBIT Growth (5y)
33.75%
EBIT to Interest (avg)
100.00
Debt to EBITDA (avg)
Net Debt is too low
Net Debt to Equity (avg)
-0.05
Sales to Capital Employed (avg)
1.76
Tax Ratio
24.60%
Dividend Payout Ratio
20.15%
Pledged Shares
0
Institutional Holding
87.91%
ROCE (avg)
29.78%
ROE (avg)
18.93%
Valuation key factors
Factor
Value
P/E Ratio
12
Industry P/E
Price to Book Value
1.21
EV to EBIT
9.23
EV to EBITDA
6.63
EV to Capital Employed
1.22
EV to Sales
0.64
PEG Ratio
NA
Dividend Yield
192.57%
ROCE (Latest)
13.18%
ROE (Latest)
10.19%
Technicals key factors
Indicator
Weekly
Monthly
MACD
Mildly Bullish
Bearish
RSI
No Signal
No Signal
Bollinger Bands
Bullish
Mildly Bearish
Moving Averages
Mildly Bearish (Daily)
KST
Mildly Bullish
Bearish
Dow Theory
Mildly Bullish
Mildly Bullish
OBV
Mildly Bullish
Mildly Bullish
 Technical Indicator Scale: Bearish, Mildly Bearish, Sideways, Mildly Bullish, Bullish Turned
 Shareholding Snapshot : Oct 2025
Shareholding Compare (%holding)
Majority shareholders
Domestic Funds
Domestic Funds
Held in 64 Schemes (35.74%)
Foreign Institutions
Held by 79 Foreign Institutions (6.05%)
Strategic Entities with highest holding
Highest Public shareholder
Quarterly Results Snapshot (Consolidated) - Jul'25 - YoY
Jul'25
Jul'24
Change(%)
Net Sales
306.40
332.70
-7.91%
Operating Profit (PBDIT) excl Other Income
33.70
38.20
-11.78%
Interest
0.10
0.10
Exceptional Items
0.00
-0.40
100.00%
Consolidate Net Profit
19.20
22.60
-15.04%
Operating Profit Margin (Excl OI)
82.30%
91.70%
-0.94%
USD in Million.

Net Sales
YoY Growth in quarter ended Jul 2025 is -7.91% vs 12.93% in Jul 2024
Consolidated Net Profit
YoY Growth in quarter ended Jul 2025 is -15.04% vs 16.49% in Jul 2024
Annual Results Snapshot (Consolidated) - Jan'25
Jan'25
Jan'24
Change(%)
Net Sales
1,202.90
1,175.90
2.30%
Operating Profit (PBDIT) excl Other Income
123.70
124.40
-0.56%
Interest
0.30
0.30
Exceptional Items
-1.50
-2.10
28.57%
Consolidate Net Profit
73.80
73.30
0.68%
Operating Profit Margin (Excl OI)
77.00%
81.30%
-0.43%
USD in Million.

Net Sales
YoY Growth in year ended Jan 2025 is 2.30% vs -6.84% in Jan 2024
Consolidated Net Profit
YoY Growth in year ended Jan 2025 is 0.68% vs -33.42% in Jan 2024
About Shoe Carnival, Inc.

Shoe Carnival, Inc.
Footwear
Shoe Carnival, Inc. is a family footwear retailer. The Company's primary activity is the sale of footwear and related products through its retail stores in approximately 30 states within the continental United States and in Puerto Rico. It also offers online shopping on its e-commerce site at www.shoecarnival.com. Its products assortment includes dress and casual shoes, sandals, boots and an assortment of athletic for the entire family in four general categories-women's, men's, children's and athletics. In addition to footwear, its stores carry selected accessory items, such as socks, belts, shoe care items, handbags, sport bags, backpacks, jewelry, scarves and wallets. It classifies athletic shoes by functionality, such as running, basketball or fitness shoes. As of January 28, 2017, it operated 415 stores in 35 states and Puerto Rico and offered online shopping at www.shoecarnival.com.
Company Coordinates
Company Details
7500 E Columbia St , EVANSVILLE IN : 47715-9127


Registrar Details
InfinHub Market Technologies FZ-LLC, Building-2, Unit 112, Dubai Internet City, Dubai, United Arab Emirates
GET THE MARKETSMOJO APP


Company
Stocks
Portfolio


"Investment in securities markets are subject to market risk. Read all the related documents carefully before investing."