
Compare Shree Ganesh Bio with Similar Stocks
Dashboard
With a Operating Losses, the company has a Weak Long Term Fundamental Strength
- Company's ability to service its debt is weak with a poor EBIT to Interest (avg) ratio of 0.65
- The company has been able to generate a Return on Equity (avg) of 2.62% signifying low profitability per unit of shareholders funds
Flat results in Mar 26
Risky - Negative EBITDA
Stock DNA
Pharmaceuticals & Biotechnology
INR 24 Cr (Micro Cap)
47.00
36
0.00%
-0.12
0.80%
0.38
Total Returns (Price + Dividend) 
Shree Ganesh Bio for the last several years.
Risk Adjusted Returns v/s
Returns Beta

News
Are Shree Ganesh Biotech India Ltd latest results good or bad?
Shree Ganesh Biotech India Ltd's latest financial results for the quarter ended March 2026 reflect significant operational challenges. The company reported a net profit loss of ₹0.15 crores, which represents a swing from a profit of ₹0.32 crores in the previous quarter, indicating a deterioration in profitability. This loss is accompanied by a deeply negative operating margin of -20.28%, which highlights ongoing issues in converting revenue into profit. Despite a sequential revenue increase of 202.86% to ₹2.12 crores from ₹0.70 crores in the previous quarter, the year-on-year revenue shows a decline of 29.57% from ₹3.01 crores in the same quarter last year. This volatility raises concerns about the sustainability of revenue growth and the company's ability to maintain a stable customer base. The company's operational performance has been marked by persistent losses, with negative operating margins recorde...
Read full news article
Shree Ganesh Biotech India Ltd is Rated Strong Sell
Shree Ganesh Biotech India Ltd is rated Strong Sell by MarketsMOJO, with this rating last updated on 08 Aug 2024. However, the analysis and financial metrics discussed here reflect the company’s current position as of 15 May 2026, providing investors with an up-to-date view of its fundamentals, valuation, financial trends, and technical outlook.
Read full news article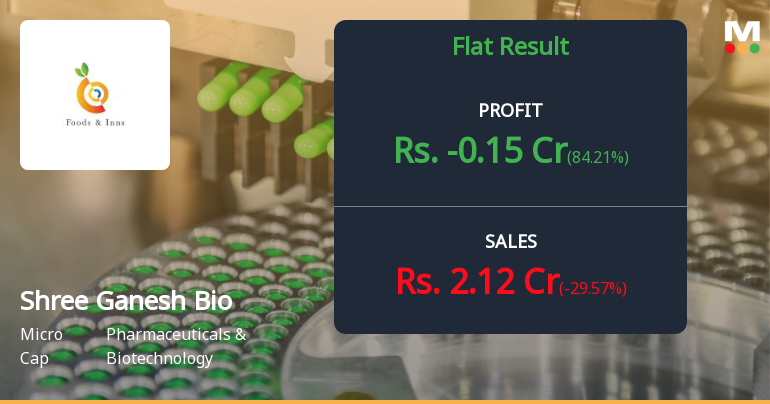
Shree Ganesh Biotech India Q4 FY26: Mounting Losses Signal Deeper Operational Crisis
Shree Ganesh Biotech India Ltd., a micro-cap pharmaceutical company with a market capitalisation of ₹24.32 crores, reported a net loss of ₹0.15 crores in Q4 FY26 (Mar'26), marking a sharp deterioration from the ₹0.32 crores profit posted in the previous quarter. The stock, currently trading at ₹0.61, has declined 34.41% over the past year, significantly underperforming the broader market and reflecting mounting investor concerns over the company's operational viability.
Read full news article Announcements
Compliances-Reg.24(A)-Annual Secretarial Compliance
23-May-2026 | Source : BSEPFA
Disclosure Under Regulation 32(1) Of SEBI (Listing Obligation And Disclosure Requirements) Regulations 2015
14-May-2026 | Source : BSEPFA
Regulation 33 Read With Regulation 30 Of SEBI (Listing Obligations And Disclosure Requirements) Regulations 2015 (Listing Regulations)
14-May-2026 | Source : BSEPFA
Corporate Actions

No Upcoming Board Meetings

No Dividend history available

Shree Ganesh Biotech India Ltd has announced 1:10 stock split, ex-date: 10 Feb 22

Shree Ganesh Biotech India Ltd has announced 1:1 bonus issue, ex-date: 27 Apr 22

No Rights history available
Quality key factors
Valuation key factors
Technicals key factors
 Technical Indicator Scale: Bearish, Mildly Bearish, Sideways, Mildly Bullish, Bullish Turned
 Shareholding Snapshot : Mar 2026
Shareholding Compare (%holding)
Non Institution
None
Held by 0 Schemes
Held by 1 FIIs (1.42%)
None
New Era Fund Limited (1.42%)
95.33%
Quarterly Results Snapshot (Standalone) - Mar'26 - YoY

YoY Growth in quarter ended Mar 2026 is -29.57% vs -20.37% in Mar 2025

YoY Growth in quarter ended Mar 2026 is 84.21% vs -275.93% in Mar 2025
Half Yearly Results Snapshot (Standalone) - Sep'25
Growth in half year ended Sep 2025 is -61.19% vs -55.21% in Sep 2024
Growth in half year ended Sep 2025 is -39.29% vs 154.55% in Sep 2024
Nine Monthly Results Snapshot (Standalone) - Dec'25
YoY Growth in nine months ended Dec 2025 is -85.71% vs 20.98% in Dec 2024
YoY Growth in nine months ended Dec 2025 is -50.38% vs 329.03% in Dec 2024
Annual Results Snapshot (Standalone) - Mar'26
YoY Growth in year ended Mar 2026 is -78.35% vs 13.21% in Mar 2025
YoY Growth in year ended Mar 2026 is 35.71% vs -54.84% in Mar 2025
About Shree Ganesh Biotech India Ltd

Company Coordinates


