
Compare Shree Vasu Logis with Similar Stocks
Dashboard
With HIgh Debt (Debt-Equity Ratio at 5.03 times)- the company has a Weak Long Term Fundamental Strength
- Company's ability to service its debt is weak with a poor EBIT to Interest (avg) ratio of 1.19
- The company has been able to generate a Return on Equity (avg) of 8.66% signifying low profitability per unit of shareholders funds
With ROCE of 8.8, it has a Expensive valuation with a 4.2 Enterprise value to Capital Employed
Despite the size of the company, domestic mutual funds hold only 0% of the company
Stock DNA
Transport Services
INR 768 Cr (Micro Cap)
138.00
34
0.00%
5.03
14.50%
20.27
Total Returns (Price + Dividend) 
Shree Vasu Logis for the last several years.
Risk Adjusted Returns v/s
Returns Beta

News
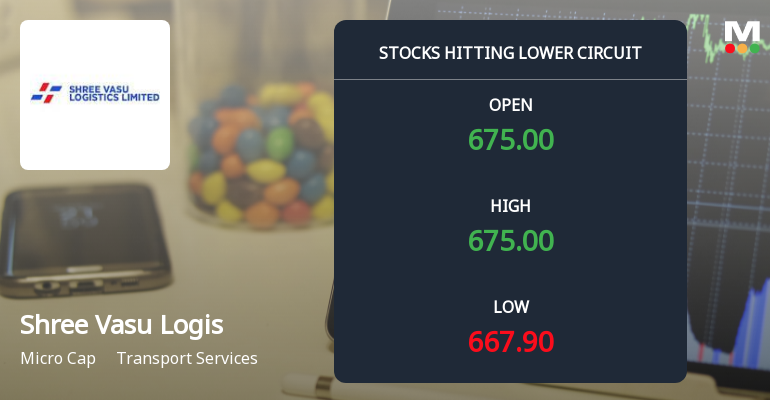
Below All Moving Averages and Now at Lower Circuit: Shree Vasu Logistics Ltd Loses 4.48% in a Single Session
At Rs 667.9, sellers were still queuing — but there were no buyers willing to take the other side. Shree Vasu Logistics Ltd locked at its lower circuit of 5%, marking a 4.48% loss on 12 Jun 2026, with unfilled sell orders and a frozen price.
Read full news article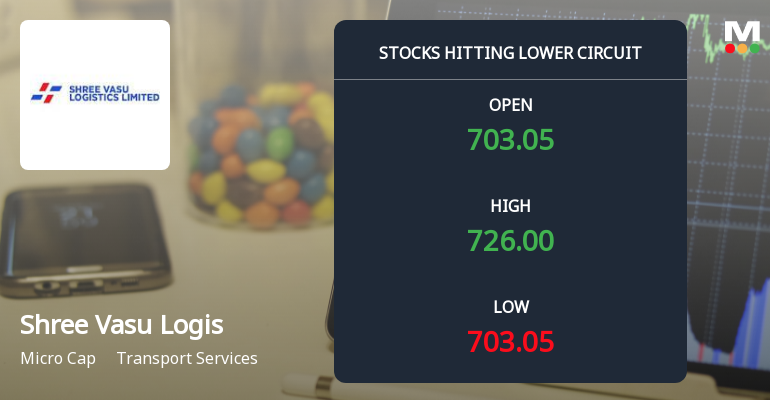
Shree Vasu Logistics Ltd Locks at Lower Circuit With 5.0% Loss — Sellers Queue, No Buyers in Sight
At Rs 703.05, sellers were still queuing — but there were no buyers willing to take the other side. Shree Vasu Logistics Ltd locked at its lower circuit of 5.0% on 11 Jun 2026, with unfilled sell orders and a frozen price, signalling a day dominated by selling pressure and a lack of demand.
Read full news article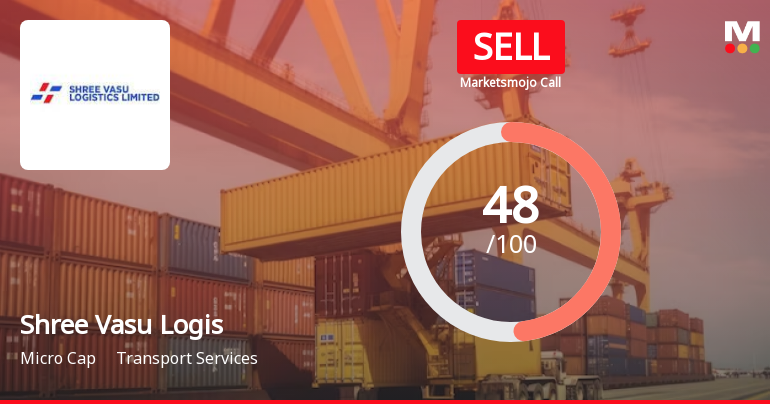
Shree Vasu Logistics Ltd is Rated Sell
Shree Vasu Logistics Ltd is rated 'Sell' by MarketsMOJO, with this rating last updated on 08 June 2026. However, the analysis and financial metrics discussed here reflect the stock's current position as of 09 June 2026, providing investors with the most up-to-date view of the company’s fundamentals, returns, and market standing.
Read full news article Announcements
Corporate Actions

No Upcoming Board Meetings

No Dividend history available

No Splits history available

Shree Vasu Logistics Ltd has announced 1:2 bonus issue, ex-date: 11 Oct 22

No Rights history available
Quality key factors
Valuation key factors
Technicals key factors
 Technical Indicator Scale: Bearish, Mildly Bearish, Sideways, Mildly Bullish, Bullish Turned
 Shareholding Snapshot : Mar 2026
Shareholding Compare (%holding)
Promoters
None
Held by 0 Schemes
Held by 0 FIIs
Atul Garg (41.67%)
B D Plywoods Private Limited (3.5%)
19.0%
Quarterly Results Snapshot (Standalone) - Mar'26 - QoQ

QoQ Growth in quarter ended Mar 2026 is 11.88% vs -0.27% in Dec 2025
QoQ Growth in quarter ended Mar 2026 is 595.59% vs -155.74% in Dec 2025
Half Yearly Results Snapshot (Standalone) - Sep'25
Growth in half year ended Sep 2025 is 54.72% vs 11.83% in Sep 2024
Growth in half year ended Sep 2025 is 340.00% vs -63.92% in Sep 2024
Nine Monthly Results Snapshot (Standalone) - Dec'25
YoY Growth in nine months ended Dec 2025 is 53.56% vs 14.51% in Dec 2024
YoY Growth in nine months ended Dec 2025 is 122.22% vs -63.01% in Dec 2024
Annual Results Snapshot (Standalone) - Mar'26
YoY Growth in year ended Mar 2026 is 53.30% vs 18.72% in Mar 2025
YoY Growth in year ended Mar 2026 is 163.93% vs -29.81% in Mar 2025
About Shree Vasu Logistics Ltd

Company Coordinates


