
Compare Shreeji Ship. Gl with Similar Stocks
Dashboard
High Management Efficiency with a high ROCE of 46.33%
Strong ability to service debt as the company has a low Debt to EBITDA ratio of 1.28 times
Poor long term growth as Net Sales has grown by an annual rate of -16.00% over the last 5 years
Negative results in Mar 26
With ROE of 20.2, it has a Very Expensive valuation with a 10.8 Price to Book Value
Majority shareholders : Promoters
Stock DNA
Transport Infrastructure
INR 8,469 Cr (Small Cap)
55.00
39
0.19%
-0.18
20.25%
10.85
Total Returns (Price + Dividend) 
Latest dividend: 1.0018796992481203 per share ex-dividend date: Feb-27-2026
Risk Adjusted Returns v/s
Returns Beta

News
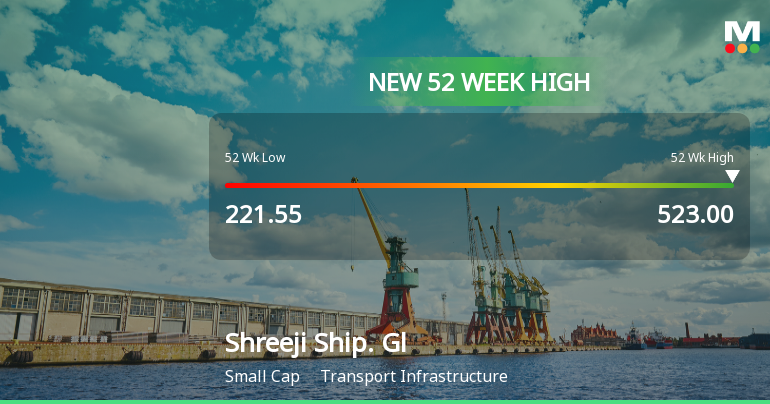
Broad-Based Technical Strength Lifts Shreeji Shipping Global Ltd to 52-Week High of Rs 523
Surging to a fresh 52-week and all-time high of Rs 523 on 3 Jul 2026, Shreeji Shipping Global Ltd has demonstrated remarkable price momentum, outperforming its sector and maintaining a steady upward trajectory over the past week.
Read full news article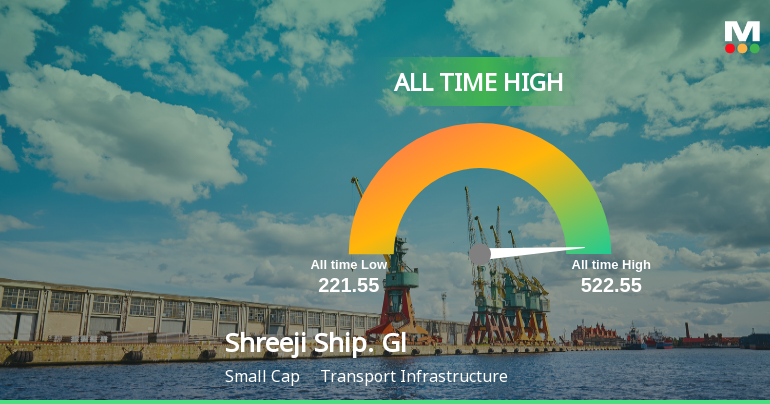

Shreeji Shipping Global Ltd is Rated Hold
Shreeji Shipping Global Ltd is rated 'Hold' by MarketsMOJO, with this rating last updated on 30 May 2026. However, the analysis and financial metrics discussed here reflect the stock's current position as of 02 July 2026, providing investors with the latest insights into its performance and outlook.
Read full news article Announcements
Closure of Trading Window
27-Jun-2026 | Source : BSEPursuant to SEBI (Prohibition of Insider Trading) Regulations 2015 as amended from time to time and Companys Code of Internal Procedures and code of conduct for Insider Trading in securities the trading window for dealing in Equity Shares of the Company by the Insiders covered under Companys Code of Internal Procedures and Conduct for Prevention of Insider Trading in Securities will be closed from Wednesday July 01 2026 till 48 hours after the declaration of Financial Results for the Quarter ended on June 30 2026.
Announcement under Regulation 30 (LODR)-Change in Management
18-Jun-2026 | Source : BSEMs. Mayuri Bipinbhai Rupareliya has been appointed as a Non-Executive Independent Director of the Company for first term of 5 (five) consecutive years with effect from March 19 2026 as approved by shareholders through Posta Ballot dated 17-06-2026.
Shareholder Meeting / Postal Ballot-Scrutinizers Report
18-Jun-2026 | Source : BSEScrutinizer Report on Special Business proposed through postal ballot under section 110 read with Section 108 of the Companies Act 2013 and Rule 20 and 22 of the Companies (Management and Administration) Rules 2014 (including any statutory modification or re-enactment thereof) dated 18-06-2026
Corporate Actions

No Upcoming Board Meetings

Shreeji Shipping Global Ltd has declared 10% dividend, ex-date: 27 Feb 26

No Splits history available

No Bonus history available

No Rights history available
Quality key factors
Valuation key factors
Technicals key factors
 Technical Indicator Scale: Bearish, Mildly Bearish, Sideways, Mildly Bullish, Bullish Turned
 Shareholding Snapshot : Mar 2026
Shareholding Compare (%holding)
Promoters
None
Held by 1 Schemes (0.91%)
Held by 11 FIIs (0.22%)
Ashokkumar Haridas Lal (41.85%)
None
4.68%
Quarterly Results Snapshot (Standalone) - Mar'26 - QoQ

QoQ Growth in quarter ended Mar 2026 is -5.35% vs 20.88% in Dec 2025

QoQ Growth in quarter ended Mar 2026 is 35.10% vs -23.79% in Dec 2025
Half Yearly Results Snapshot (Standalone) - Sep'25
Not Applicable: The company has declared_date for only one period
Not Applicable: The company has declared_date for only one period
Nine Monthly Results Snapshot (Standalone) - Dec'25
Not Applicable: The company has declared_date for only one period
Not Applicable: The company has declared_date for only one period
Annual Results Snapshot (Standalone) - Mar'26
YoY Growth in year ended Mar 2026 is 20.70% vs -20.10% in Mar 2025
YoY Growth in year ended Mar 2026 is 8.64% vs 15.63% in Mar 2025
About Shreeji Shipping Global Ltd

Company Coordinates


