
Compare Shreeji Ship. Gl with Similar Stocks
Dashboard
High Management Efficiency with a high ROCE of 46.33%
Strong ability to service debt as the company has a low Debt to EBITDA ratio of 1.28 times
Poor long term growth as Net Sales has grown by an annual rate of -16.00% over the last 5 years
Negative results in Mar 26
With ROE of 20.2, it has a Very Expensive valuation with a 10.2 Price to Book Value
Majority shareholders : Promoters
Stock DNA
Transport Infrastructure
INR 7,464 Cr (Small Cap)
52.00
34
0.22%
-0.18
20.25%
9.51
Total Returns (Price + Dividend) 
Latest dividend: 1 per share ex-dividend date: Feb-27-2026
Risk Adjusted Returns v/s
Returns Beta

News
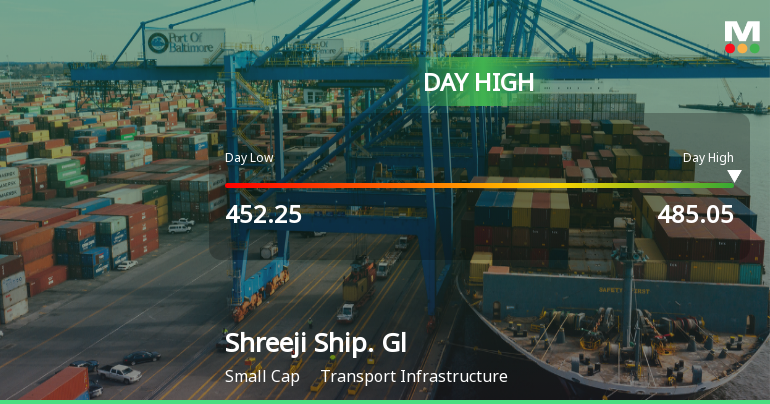
Shreeji Shipping Global Ltd Surges 7.09% to Day's High of Rs 485.05 — Outperforms Sector by 5.21 Percentage Points
The Sensex climbed 2.30% on 12 Jun 2026, yet Shreeji Shipping Global Ltd outpaced the broader market with a 7.09% gain, touching an intraday high of Rs 485.05. This 5.21 percentage-point outperformance over its Transport Infrastructure sector peers highlights a distinctly stock-specific rally rather than a market-wide surge.
Read full news article
Shreeji Shipping Global Ltd is Rated Hold
Shreeji Shipping Global Ltd is rated 'Hold' by MarketsMOJO, with this rating last updated on 30 May 2026. However, the analysis and financial metrics presented here reflect the stock's current position as of 10 June 2026, providing investors with the latest insights into its performance and outlook.
Read full news article
Shreeji Shipping Global Ltd Technical Momentum Shifts Amid Mixed Signals
Shreeji Shipping Global Ltd, a small-cap player in the Transport Infrastructure sector, has experienced a notable shift in its technical momentum, moving from a bullish to a mildly bullish trend. This change is underscored by mixed signals from key technical indicators such as MACD, RSI, Bollinger Bands, and moving averages, reflecting a nuanced market sentiment as the stock trades near its 52-week high.
Read full news article Announcements
Corporate Actions

No Upcoming Board Meetings

Shreeji Shipping Global Ltd has declared 10% dividend, ex-date: 27 Feb 26

No Splits history available

No Bonus history available

No Rights history available
Quality key factors
Valuation key factors
Technicals key factors
 Technical Indicator Scale: Bearish, Mildly Bearish, Sideways, Mildly Bullish, Bullish Turned
 Shareholding Snapshot : Mar 2026
Shareholding Compare (%holding)
Promoters
None
Held by 1 Schemes (0.91%)
Held by 11 FIIs (0.22%)
Ashokkumar Haridas Lal (41.85%)
None
4.68%
Quarterly Results Snapshot (Standalone) - Mar'26 - QoQ

QoQ Growth in quarter ended Mar 2026 is -5.35% vs 20.88% in Dec 2025

QoQ Growth in quarter ended Mar 2026 is 35.10% vs -23.79% in Dec 2025
Half Yearly Results Snapshot (Standalone) - Sep'25
Not Applicable: The company has declared_date for only one period
Not Applicable: The company has declared_date for only one period
Nine Monthly Results Snapshot (Standalone) - Dec'25
Not Applicable: The company has declared_date for only one period
Not Applicable: The company has declared_date for only one period
Annual Results Snapshot (Standalone) - Mar'26
YoY Growth in year ended Mar 2026 is 20.70% vs -20.10% in Mar 2025
YoY Growth in year ended Mar 2026 is 8.64% vs 15.63% in Mar 2025
About Shreeji Shipping Global Ltd

Company Coordinates


