
Compare Shrem InvIT with Similar Stocks
Dashboard
Weak Long Term Fundamental Strength with a 14.90% CAGR growth in Net Sales over the last 5 years
- Low ability to service debt as the company has a high Debt to EBITDA ratio of 5.97 times
The company has declared Negative results for the last 3 consecutive quarters
26.51% of Promoter Shares are Pledged
Below par performance in long term as well as near term
Stock DNA
Construction
INR 6,231 Cr (Small Cap)
7.00
33
13.73%
1.17
14.26%
1.04
Total Returns (Price + Dividend) 
Latest dividend: 3 per share ex-dividend date: Mar-27-2026
Risk Adjusted Returns v/s
Returns Beta

News
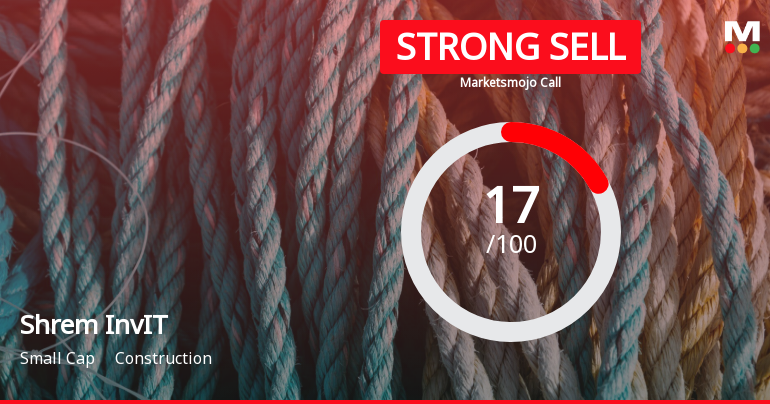
Shrem InvIT is Rated Strong Sell
Shrem InvIT is rated Strong Sell by MarketsMOJO, with this rating last updated on 06 February 2026. However, the analysis and financial metrics discussed here reflect the stock’s current position as of 17 July 2026, providing investors with an up-to-date view of its fundamentals, returns, and technical outlook.
Read full news article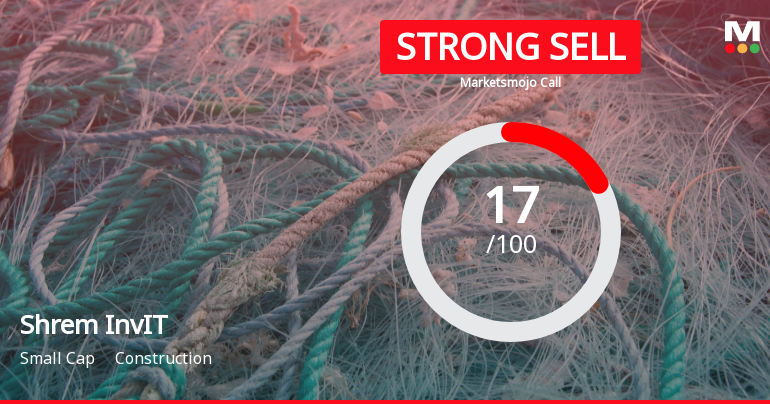
Shrem InvIT is Rated Strong Sell
Shrem InvIT is rated Strong Sell by MarketsMOJO, with this rating last updated on 06 Feb 2026. However, the analysis and financial metrics discussed here reflect the stock’s current position as of 06 July 2026, providing investors with an up-to-date view of its fundamentals, returns, and market standing.
Read full news article
Shrem InvIT is Rated Strong Sell
Shrem InvIT is rated Strong Sell by MarketsMOJO, with this rating last updated on 06 February 2026. However, the analysis and financial metrics discussed here reflect the stock’s current position as of 25 June 2026, providing investors with the latest insights into its performance and outlook.
Read full news article Announcements
Corporate Actions

No Upcoming Board Meetings

Shrem InvIT has declared 3% dividend, ex-date: 27 Mar 26

No Splits history available

No Bonus history available

No Rights history available
Quality key factors
Valuation key factors
Technicals key factors
 Technical Indicator Scale: Bearish, Mildly Bearish, Sideways, Mildly Bullish, Bullish Turned
 Shareholding Snapshot : Mar 2026
Shareholding Compare (%holding)
Promoters
26.5083
Held by 0 Schemes
Held by 0 FIIs
Shrem Infra Invest Private Limited (40.23%)
Kote Gate Fund Investment Account (0.11%)
11.78%
Quarterly Results Snapshot (Consolidated) - Mar'26 - QoQ

QoQ Growth in quarter ended Mar 2026 is 11.31% vs -17.40% in Dec 2025
QoQ Growth in quarter ended Mar 2026 is 110.39% vs -34.93% in Dec 2025
Half Yearly Results Snapshot (Consolidated) - Sep'25

Growth in half year ended Sep 2025 is -22.30% vs 37.46% in Mar 2025
Growth in half year ended Sep 2025 is -16.23% vs -10.63% in Mar 2025
Nine Monthly Results Snapshot (Consolidated) - Dec'25
YoY Growth in nine months ended Dec 2025 is -2.08% vs 63.20% in Dec 2024
YoY Growth in nine months ended Dec 2025 is -30.27% vs 106.01% in Dec 2024
Annual Results Snapshot (Consolidated) - Mar'26
YoY Growth in year ended Mar 2026 is -14.57% vs 25.86% in Mar 2025
YoY Growth in year ended Mar 2026 is -23.16% vs 6.26% in Mar 2025
About Shrem InvIT

Company Coordinates


