
Compare Shri Keshav with Similar Stocks
Dashboard
High Debt company with Weak Long Term Fundamental Strength
- Poor long term growth as Net Sales has grown by an annual rate of 14.93% and Operating profit at 11.43% over the last 5 years
- High Debt Company with a Debt to Equity ratio (avg) of 3.96 times
- The company has been able to generate a Return on Capital Employed (avg) of 7.99% signifying low profitability per unit of total capital (equity and debt)
- PAT(Q) At Rs -9.76 cr has Fallen at -121.3%
- INTEREST(Latest six months) At Rs 12.23 cr has Grown at 30.94%
- OPERATING PROFIT TO INTEREST (Q) Lowest at 1.14 times
Falling Participation by Institutional Investors
Stock DNA
Cement & Cement Products
INR 218 Cr (Micro Cap)
NA (Loss Making)
34
0.00%
2.56
-7.27%
2.36
Total Returns (Price + Dividend) 
Latest dividend: 0.8872289356240041 per share ex-dividend date: Sep-20-2017
Risk Adjusted Returns v/s
Returns Beta

News

Shri Keshav Cements & Infra Ltd is Rated Strong Sell
Shri Keshav Cements & Infra Ltd is rated Strong Sell by MarketsMOJO, with this rating last updated on 30 May 2026. However, the analysis and financial metrics presented here reflect the stock’s current position as of 15 July 2026, providing investors with an up-to-date view of the company’s fundamentals, valuation, financial trends, and technical outlook.
Read full news article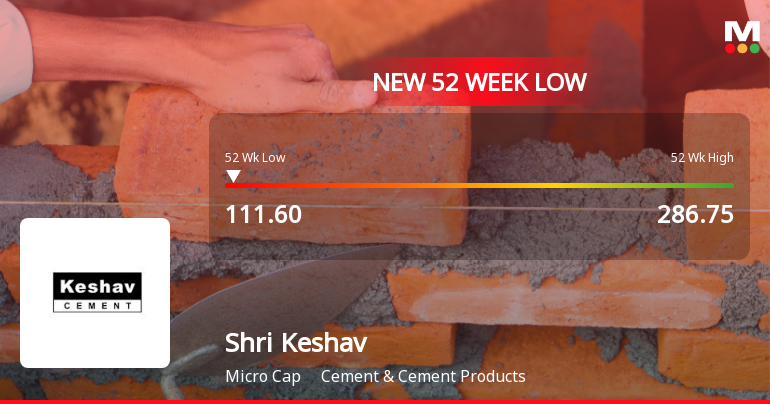
Markets Rally, But Shri Keshav Cements & Infra Ltd Sinks to 52-Week Low in Stock-Specific Sell-Off
While the Sensex climbed 0.72% to 77,053.50 on 9 Jul 2026, Shri Keshav Cements & Infra Ltd plunged to a fresh 52-week low of Rs 111.6, marking a 5.78% intraday drop and extending its losing streak to three consecutive sessions with an 11.35% decline over this period.
Read full news article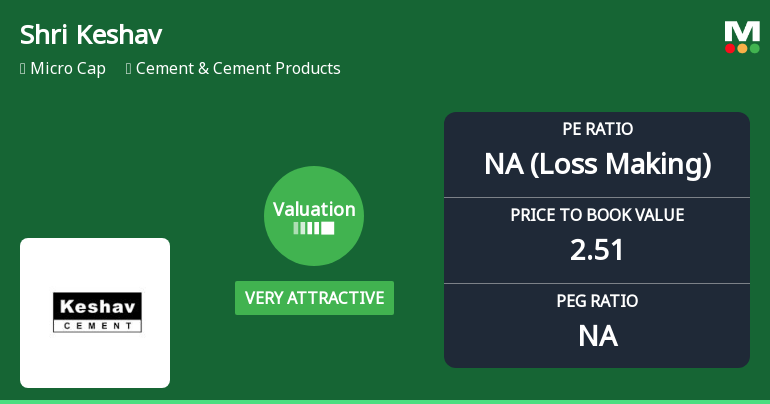
Shri Keshav Cements & Infra Ltd Valuation Turns Very Attractive Amid Market Challenges
Shri Keshav Cements & Infra Ltd has seen a significant shift in its valuation parameters, moving from an attractive to a very attractive rating despite ongoing market headwinds and a challenging operational environment. This revaluation comes amid a backdrop of negative returns relative to the Sensex and deteriorating profitability metrics, raising important questions about the stock’s price attractiveness and investment potential within the cement sector.
Read full news article Announcements
Compliances-Certificate under Reg. 74 (5) of SEBI (DP) Regulations 2018
07-Jul-2026 | Source : BSEHerewith we have attached the Certificate received from our RTA in compliance under Regulation 74(5) of SEBI (DP) Regulations 2018 for the quarter ended 30/06/2026
Closure of Trading Window
29-Jun-2026 | Source : BSEThe trading window for dealing in securities of the company shall remain closed for all Directors Designated Persons and their immediate relatives and other persons covered under the Code w.e.f. 01/07/2026 and upto 48 hours after the declaration of Financial Results for the Quarter ended 30/06/2026.
Announcement under Regulation 30 (LODR)-Credit Rating
09-Jun-2026 | Source : BSEWe wish to inform you that Infomerics Ratings has reaffirmed the Ratings to the company as per the below attachment.
Corporate Actions

No Upcoming Board Meetings

Shri Keshav Cements & Infra Ltd has declared 10% dividend, ex-date: 20 Sep 17

No Splits history available

No Bonus history available

Shri Keshav Cements & Infra Ltd has announced 1341:1000 rights issue, ex-date: 18 Sep 19
Quality key factors
Valuation key factors
Technicals key factors
 Technical Indicator Scale: Bearish, Mildly Bearish, Sideways, Mildly Bullish, Bullish Turned
 Shareholding Snapshot : Jun 2026
Shareholding Compare (%holding)
Promoters
None
Held by 0 Schemes
Held by 4 FIIs (9.72%)
Deepak Katwa (12.7%)
Forbes Emf (4.57%)
11.54%
Quarterly Results Snapshot (Standalone) - Mar'26 - YoY

YoY Growth in quarter ended Mar 2026 is 22.98% vs 6.69% in Mar 2025
YoY Growth in quarter ended Mar 2026 is -121.32% vs -282.99% in Mar 2025
Half Yearly Results Snapshot (Standalone) - Sep'25
Growth in half year ended Sep 2025 is 38.60% vs -2.66% in Sep 2024
Growth in half year ended Sep 2025 is 257.50% vs -187.27% in Sep 2024
Nine Monthly Results Snapshot (Standalone) - Dec'25
YoY Growth in nine months ended Dec 2025 is 37.38% vs -8.19% in Dec 2024
YoY Growth in nine months ended Dec 2025 is 284.09% vs -126.19% in Dec 2024
Annual Results Snapshot (Standalone) - Mar'26
YoY Growth in year ended Mar 2026 is 32.82% vs -3.95% in Mar 2025
YoY Growth in year ended Mar 2026 is -5.83% vs -167.58% in Mar 2025
About Shri Keshav Cements & Infra Ltd

Company Coordinates


