
Compare Shriram Finance with Similar Stocks
Dashboard
Strong Long Term Fundamental Strength with an average Return on Equity (ROE) of 13.77%
Healthy long term growth as Net Sales has grown by an annual rate of 22.54% and Operating profit at 23.07%
The company has declared Positive results for the last 10 consecutive quarters
Consistent Returns over the last 3 years
Stock DNA
Non Banking Financial Company (NBFC)
INR 232,703 Cr (Large Cap)
24.00
21
0.63%
3.80
15.21%
3.54
Total Returns (Price + Dividend) 
Latest dividend: 4.791782329562825 per share ex-dividend date: Nov-07-2025
Risk Adjusted Returns v/s
Returns Beta

News
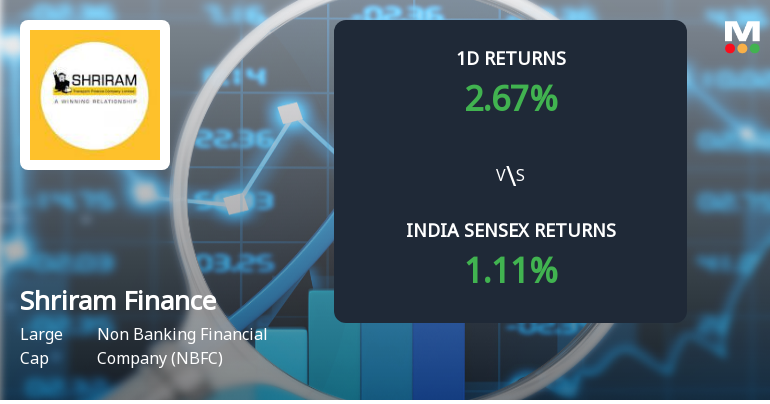
Shriram Finance Sees Sharp Open Interest Surge Signalling Bullish Market Positioning
Shriram Finance Ltd, a leading large-cap NBFC, has witnessed a significant surge in open interest (OI) in its derivatives segment, signalling heightened market activity and potential directional bets. The stock outperformed its sector and broader indices, supported by strong volume and positive price momentum, reflecting renewed investor confidence and evolving market positioning.
Read full news article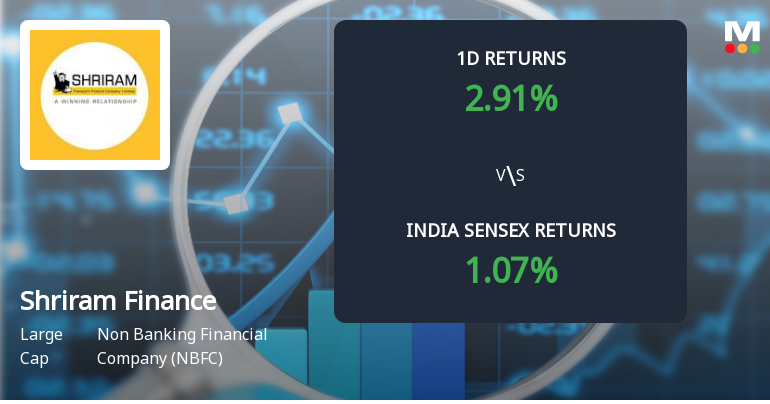
Shriram Finance Sees Sharp Open Interest Surge Amid Bullish Market Positioning
Shriram Finance Ltd (SHRIRAMFIN), a leading large-cap NBFC, has witnessed a significant surge in open interest (OI) in its derivatives segment, signalling heightened market activity and potential directional bets. The stock outperformed its sector and the broader Sensex, supported by robust volume patterns and improved investor sentiment, following an upgrade in its Mojo Grade to Buy.
Read full news article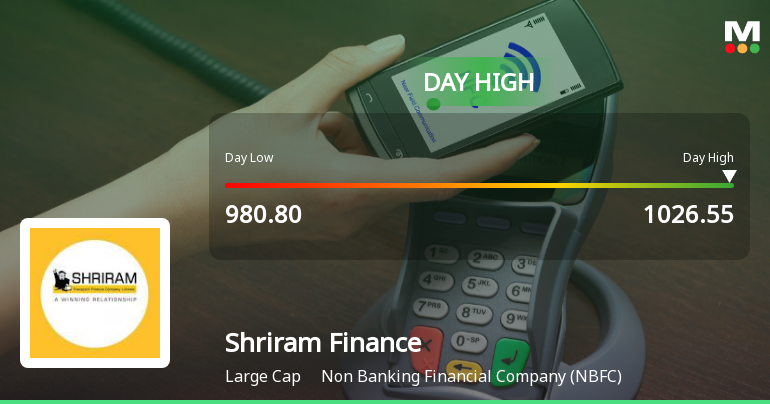
Shriram Finance Ltd Surges 3.22% to Day's High of Rs 1023.95 — Outperforms Sector by 1.94 Percentage Points
The Sensex climbed 1.14% on 24 Jun 2026, yet Shriram Finance Ltd outpaced both the benchmark and its sector peers with a 3.22% gain, touching an intraday high of Rs 1023.95. That 1.94-percentage-point outperformance signals a stock-specific strength rather than a mere market tailwind.
Read full news article Announcements
Announcement under Regulation 30 (LODR)-Analyst / Investor Meet - Intimation
19-Jun-2026 | Source : BSEPursuant to Regulation 30 of the SEBI Listing Regulations 2015 read with Schedule III thereto this is informing that Fund/ Analysts/ Institutional Investor/ Broker/Broker Conference /meeting is scheduled to be held on Wednesday June 24 2026 which will be attended by the senior management/ management personnel of the Company. The discussion will be based on investor presentation and public domain disclosures. In accordance with the said Regulation(s) please find below the detail of scheduled meeting with the Fund/ Analyst/ Institutional Investor/ Broker/ Broker Conference etc at IIFL Invest India Conference.
Announcement under Regulation 30 (LODR)-Analyst / Investor Meet - Intimation
19-Jun-2026 | Source : BSEPursuant to Regulation 30 of the SEBI Listing Regulations 2015 read with Schedule III thereto this is informing that Fund/ Analysts/ Institutional Investor/ Broker/Broker Conference /meeting is scheduled to be held on Tuesday June 23 2026 which will be attended by the senior management/ management personnel of the Company.
Announcement under Regulation 30 (LODR)-Analyst / Investor Meet - Intimation
19-Jun-2026 | Source : BSEPursuant to Regulation 30 of the SEBI Listing Regulations 2015 read with Schedule III thereto this is informing that Fund/ Analysts/ Institutional Investor/ Broker/Broker Conference /meeting is scheduled to be held on Wednesday June 24 2026 which will be attended by the senior management/ management personnel of the Company. The discussion will be based on investor presentation and public domain disclosures. In accordance with the said Regulation(s) please find below the detail of scheduled meeting with the Fund/ Analyst/ Institutional Investor/ Broker/ Broker Conference etc. at JM Financial India Finance Forum Conference.
Corporate Actions

No Upcoming Board Meetings

Shriram Finance Ltd has declared 300% dividend, ex-date: 03 Jul 26

Shriram Finance Ltd has announced 2:10 stock split, ex-date: 10 Jan 25

No Bonus history available

Shriram Finance Ltd has announced 3:26 rights issue, ex-date: 09 Jul 20
Quality key factors
Valuation key factors
Technicals key factors
 Technical Indicator Scale: Bearish, Mildly Bearish, Sideways, Mildly Bullish, Bullish Turned
 Shareholding Snapshot : Apr 2026
Shareholding Compare (%holding)
FIIs
None
Held by 48 Schemes (13.07%)
Held by 1160 FIIs (56.13%)
Shriram Capital Private Limited (14.27%)
Mufg Bank Limited (20.02%)
3.93%
Quarterly Results Snapshot (Consolidated) - Mar'26 - QoQ

QoQ Growth in quarter ended Mar 2026 is 2.82% vs 2.17% in Dec 2025
QoQ Growth in quarter ended Mar 2026 is 19.42% vs 9.31% in Dec 2025
Half Yearly Results Snapshot (Consolidated) - Sep'25
Growth in half year ended Sep 2025 is 19.14% vs 18.86% in Sep 2024

Growth in half year ended Sep 2025 is 7.46% vs 19.24% in Sep 2024
Nine Monthly Results Snapshot (Consolidated) - Dec'25
YoY Growth in nine months ended Dec 2025 is 17.25% vs 19.23% in Dec 2024
YoY Growth in nine months ended Dec 2025 is -5.49% vs 38.31% in Dec 2024
Annual Results Snapshot (Consolidated) - Mar'26
YoY Growth in year ended Mar 2026 is 15.06% vs 19.65% in Mar 2025
YoY Growth in year ended Mar 2026 is 4.92% vs 29.69% in Mar 2025
About Shriram Finance Ltd

Company Coordinates


