
Compare Shyam Century with Similar Stocks
Dashboard
With a Operating Losses, the company has a Weak Long Term Fundamental Strength
- The company has been able to generate a Return on Equity (avg) of 9.91% signifying low profitability per unit of shareholders funds
The company has declared Negative results for the last 5 consecutive quarters
Risky - Negative EBITDA
Below par performance in long term as well as near term
Stock DNA
Ferrous Metals
INR 106 Cr (Micro Cap)
NA (Loss Making)
61
0.00%
-0.06
-5.60%
0.68
Total Returns (Price + Dividend) 
Latest dividend: 0.29860465116279067 per share ex-dividend date: Aug-23-2022
Risk Adjusted Returns v/s
Returns Beta

News
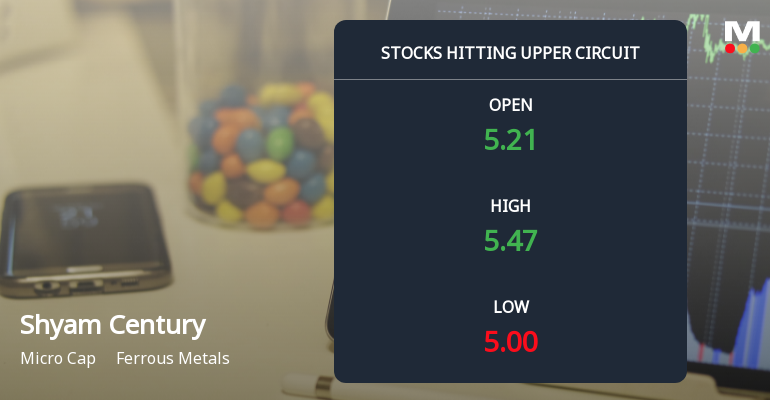
Shyam Century Ferrous Ltd Locks at Upper Circuit With 1.15% Gain — Buyers Queue, Sellers Absent
At Rs 5.47, the buying was done — not because demand dried up, but because the exchange wouldn't let the stock go any higher. Shyam Century Ferrous Ltd locked at its upper circuit of 5% on 21 Jul 2026, with buyers queuing and no sellers willing to part with shares.
Read full news article
Shyam Century Ferrous Ltd is Rated Strong Sell
Shyam Century Ferrous Ltd is rated Strong Sell by MarketsMOJO. This rating was last updated on 11 May 2026. However, the analysis and financial metrics discussed below reflect the company’s current position as of 19 July 2026, providing investors with the latest insights into the stock’s performance and fundamentals.
Read full news article
Shyam Century Ferrous Ltd is Rated Strong Sell
Shyam Century Ferrous Ltd is rated Strong Sell by MarketsMOJO, with this rating last updated on 11 May 2026. However, the analysis and financial metrics discussed here reflect the company’s current position as of 08 July 2026, providing investors with an up-to-date view of its fundamentals, valuation, financial trend, and technical standing.
Read full news article Announcements
Shyam Century Ferrous Limited - Credit Rating
15-Nov-2019 | Source : NSEShyam Century Ferrous Limited has informed the Exchange regarding Credit Rating
Updates
31-Aug-2019 | Source : NSE
| Shyam Century Ferrous Limited has informed the Exchange regarding 'Pursuant to Regulations 30 & 47 of the SEBI (Listing Obligations and Disclosure Requirements) Regulations, 2015, please find enclosed herewith Copies of the newspaper advertisements confirming the completion of dispatch of the Annual Report, Accounts together with Notice of the 8th Annual General Meeting through permitted modes as published in the Business Standard (All India Edition) and Hima (Khasi Edition) dated 31st August, 2019.This is for your information and record.'. |
Shareholders meeting
30-Aug-2019 | Source : NSE
| Shyam Century Ferrous Limited has informed the Exchange regarding Notice of Annual General Meeting to be held on September 27, 2019Pursuant to Regulation 30 & 34 of the LODR Regulations, we enclose herewith a copy of the Annual Report, Accounts together with Notice of 8th Annual General Meeting of the Company scheduled to be held on Friday, 27th September, 2019 at 04:00 P.M. at ??Star Club??, Vill: Lumshnong, P.O.: Khaliehriat, Dist.: East Jaintia Hills, Meghalaya ?? 793210. The Proxy Form and Attendance Slip are also forming part of the Annual Report 2018-19.This is for your information and record. |
Corporate Actions

No Upcoming Board Meetings

Shyam Century Ferrous Ltd has declared 30% dividend, ex-date: 23 Aug 22

No Splits history available

No Bonus history available

No Rights history available
Quality key factors
Valuation key factors
Technicals key factors
 Technical Indicator Scale: Bearish, Mildly Bearish, Sideways, Mildly Bullish, Bullish Turned
 Shareholding Snapshot : Mar 2026
Shareholding Compare (%holding)
Non Institution
None
Held by 0 Schemes
Held by 1 FIIs (0.0%)
Brijdham Merchants Pvt Ltd (7.8%)
Subham Buildwell Private Limited (13.13%)
31.73%
Quarterly Results Snapshot (Standalone) - Mar'26 - QoQ

QoQ Growth in quarter ended Mar 2026 is -83.33% vs -88.38% in Dec 2025
QoQ Growth in quarter ended Mar 2026 is 103.26% vs -867.50% in Dec 2025
Half Yearly Results Snapshot (Standalone) - Sep'25

Growth in half year ended Sep 2025 is -63.27% vs -11.00% in Sep 2024
Growth in half year ended Sep 2025 is 35.40% vs -506.50% in Sep 2024
Nine Monthly Results Snapshot (Standalone) - Dec'25
YoY Growth in nine months ended Dec 2025 is -75.53% vs -6.51% in Dec 2024
YoY Growth in nine months ended Dec 2025 is -89.68% vs -303.29% in Dec 2024
Annual Results Snapshot (Standalone) - Mar'26
YoY Growth in year ended Mar 2026 is -80.20% vs -18.06% in Mar 2025
YoY Growth in year ended Mar 2026 is 1.50% vs -1,375.34% in Mar 2025
About Shyam Century Ferrous Ltd

Company Coordinates


